Developer tools
PC
Windows 10 version 17763.0 or higher
Integrated Keyboard
Integrated Mouse
English (United States)
If you've ever been caught in the maze of Windows crashes or mysterious system behaviors, WinDbg for Windows is like a seasoned detective ready to unravel the secrets behind those pesky errors. Designed for developers and system administrators alike, this tool transforms raw crash dumps into understandable insights. Let's explore what makes this application a must-have for serious troubleshooting and debugging efforts.
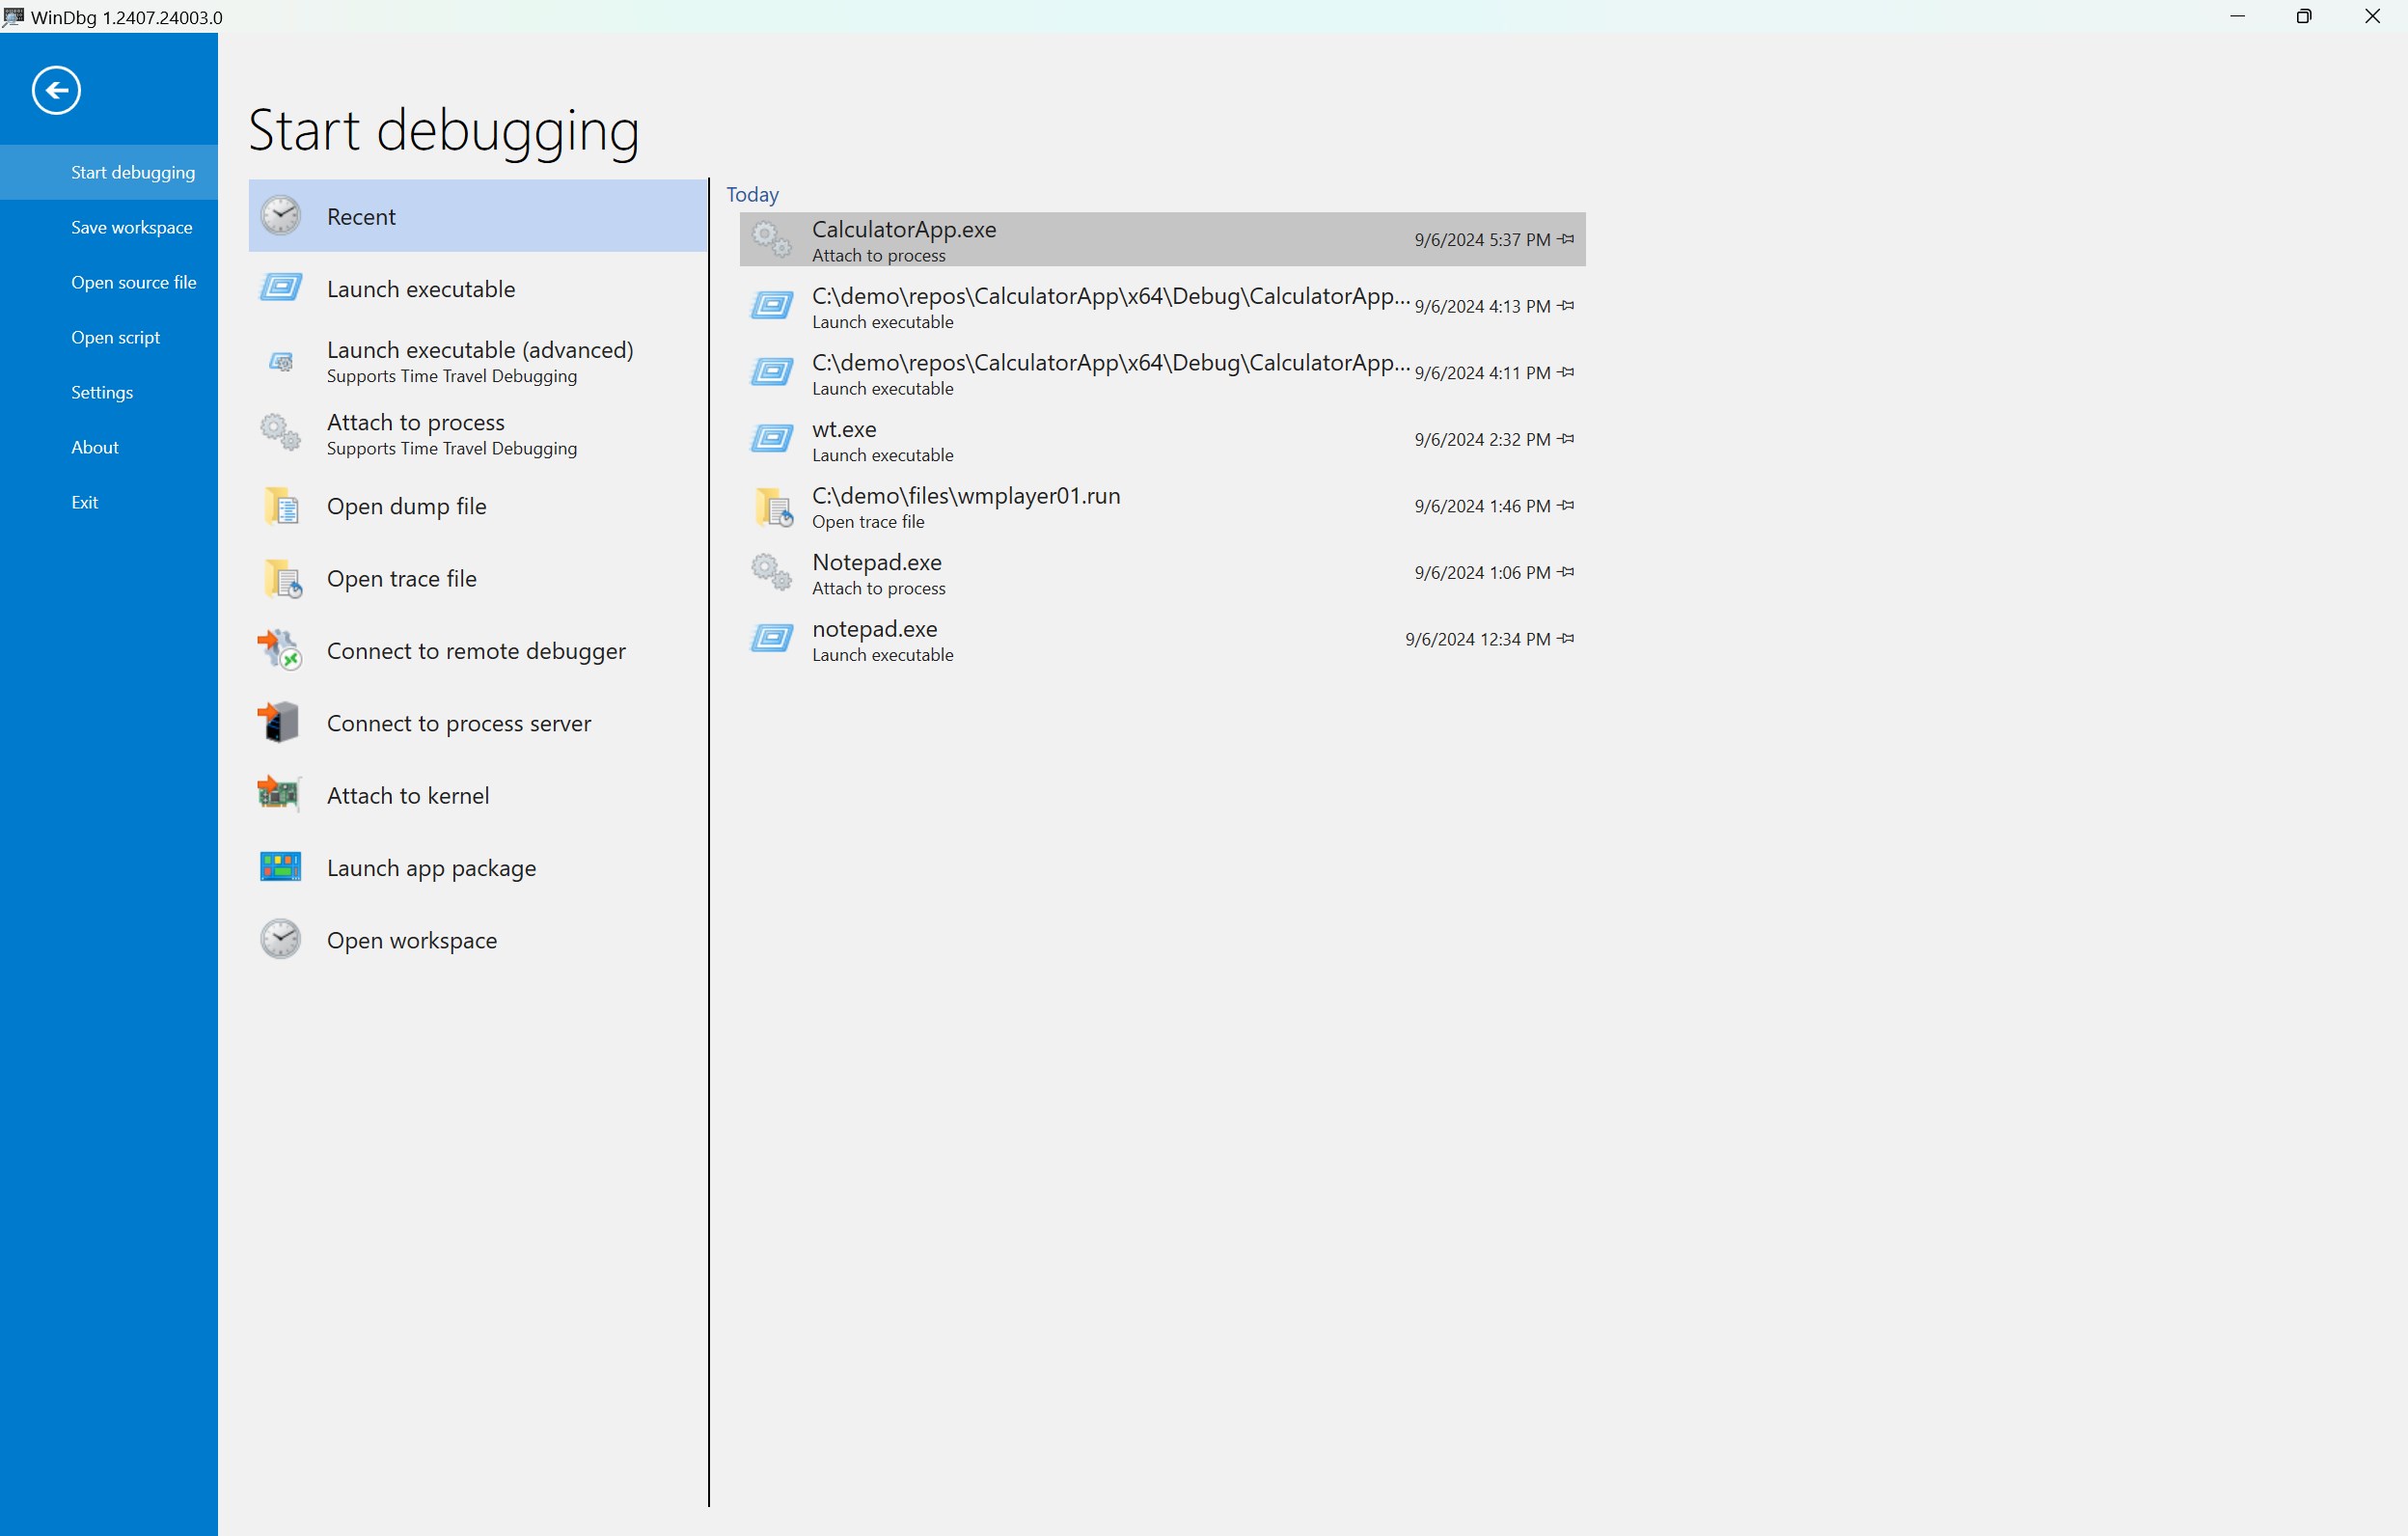
Developed by Microsoft Corporation and available through the Microsoft Store, WinDbg for Windows positions itself as a professional-grade debugging platform tailored for Windows environments. Its primary mission is to analyze crash dumps, debug live systems, and provide detailed insights into system and application faults. The app's main highlights include intuitive visualizations of call stacks, comprehensive symbol management, and real-time code analysis. Targeted primarily at developers, IT professionals, and system administrators, the application aims to simplify complex debugging tasks that often seem akin to decoding ancient scripts.
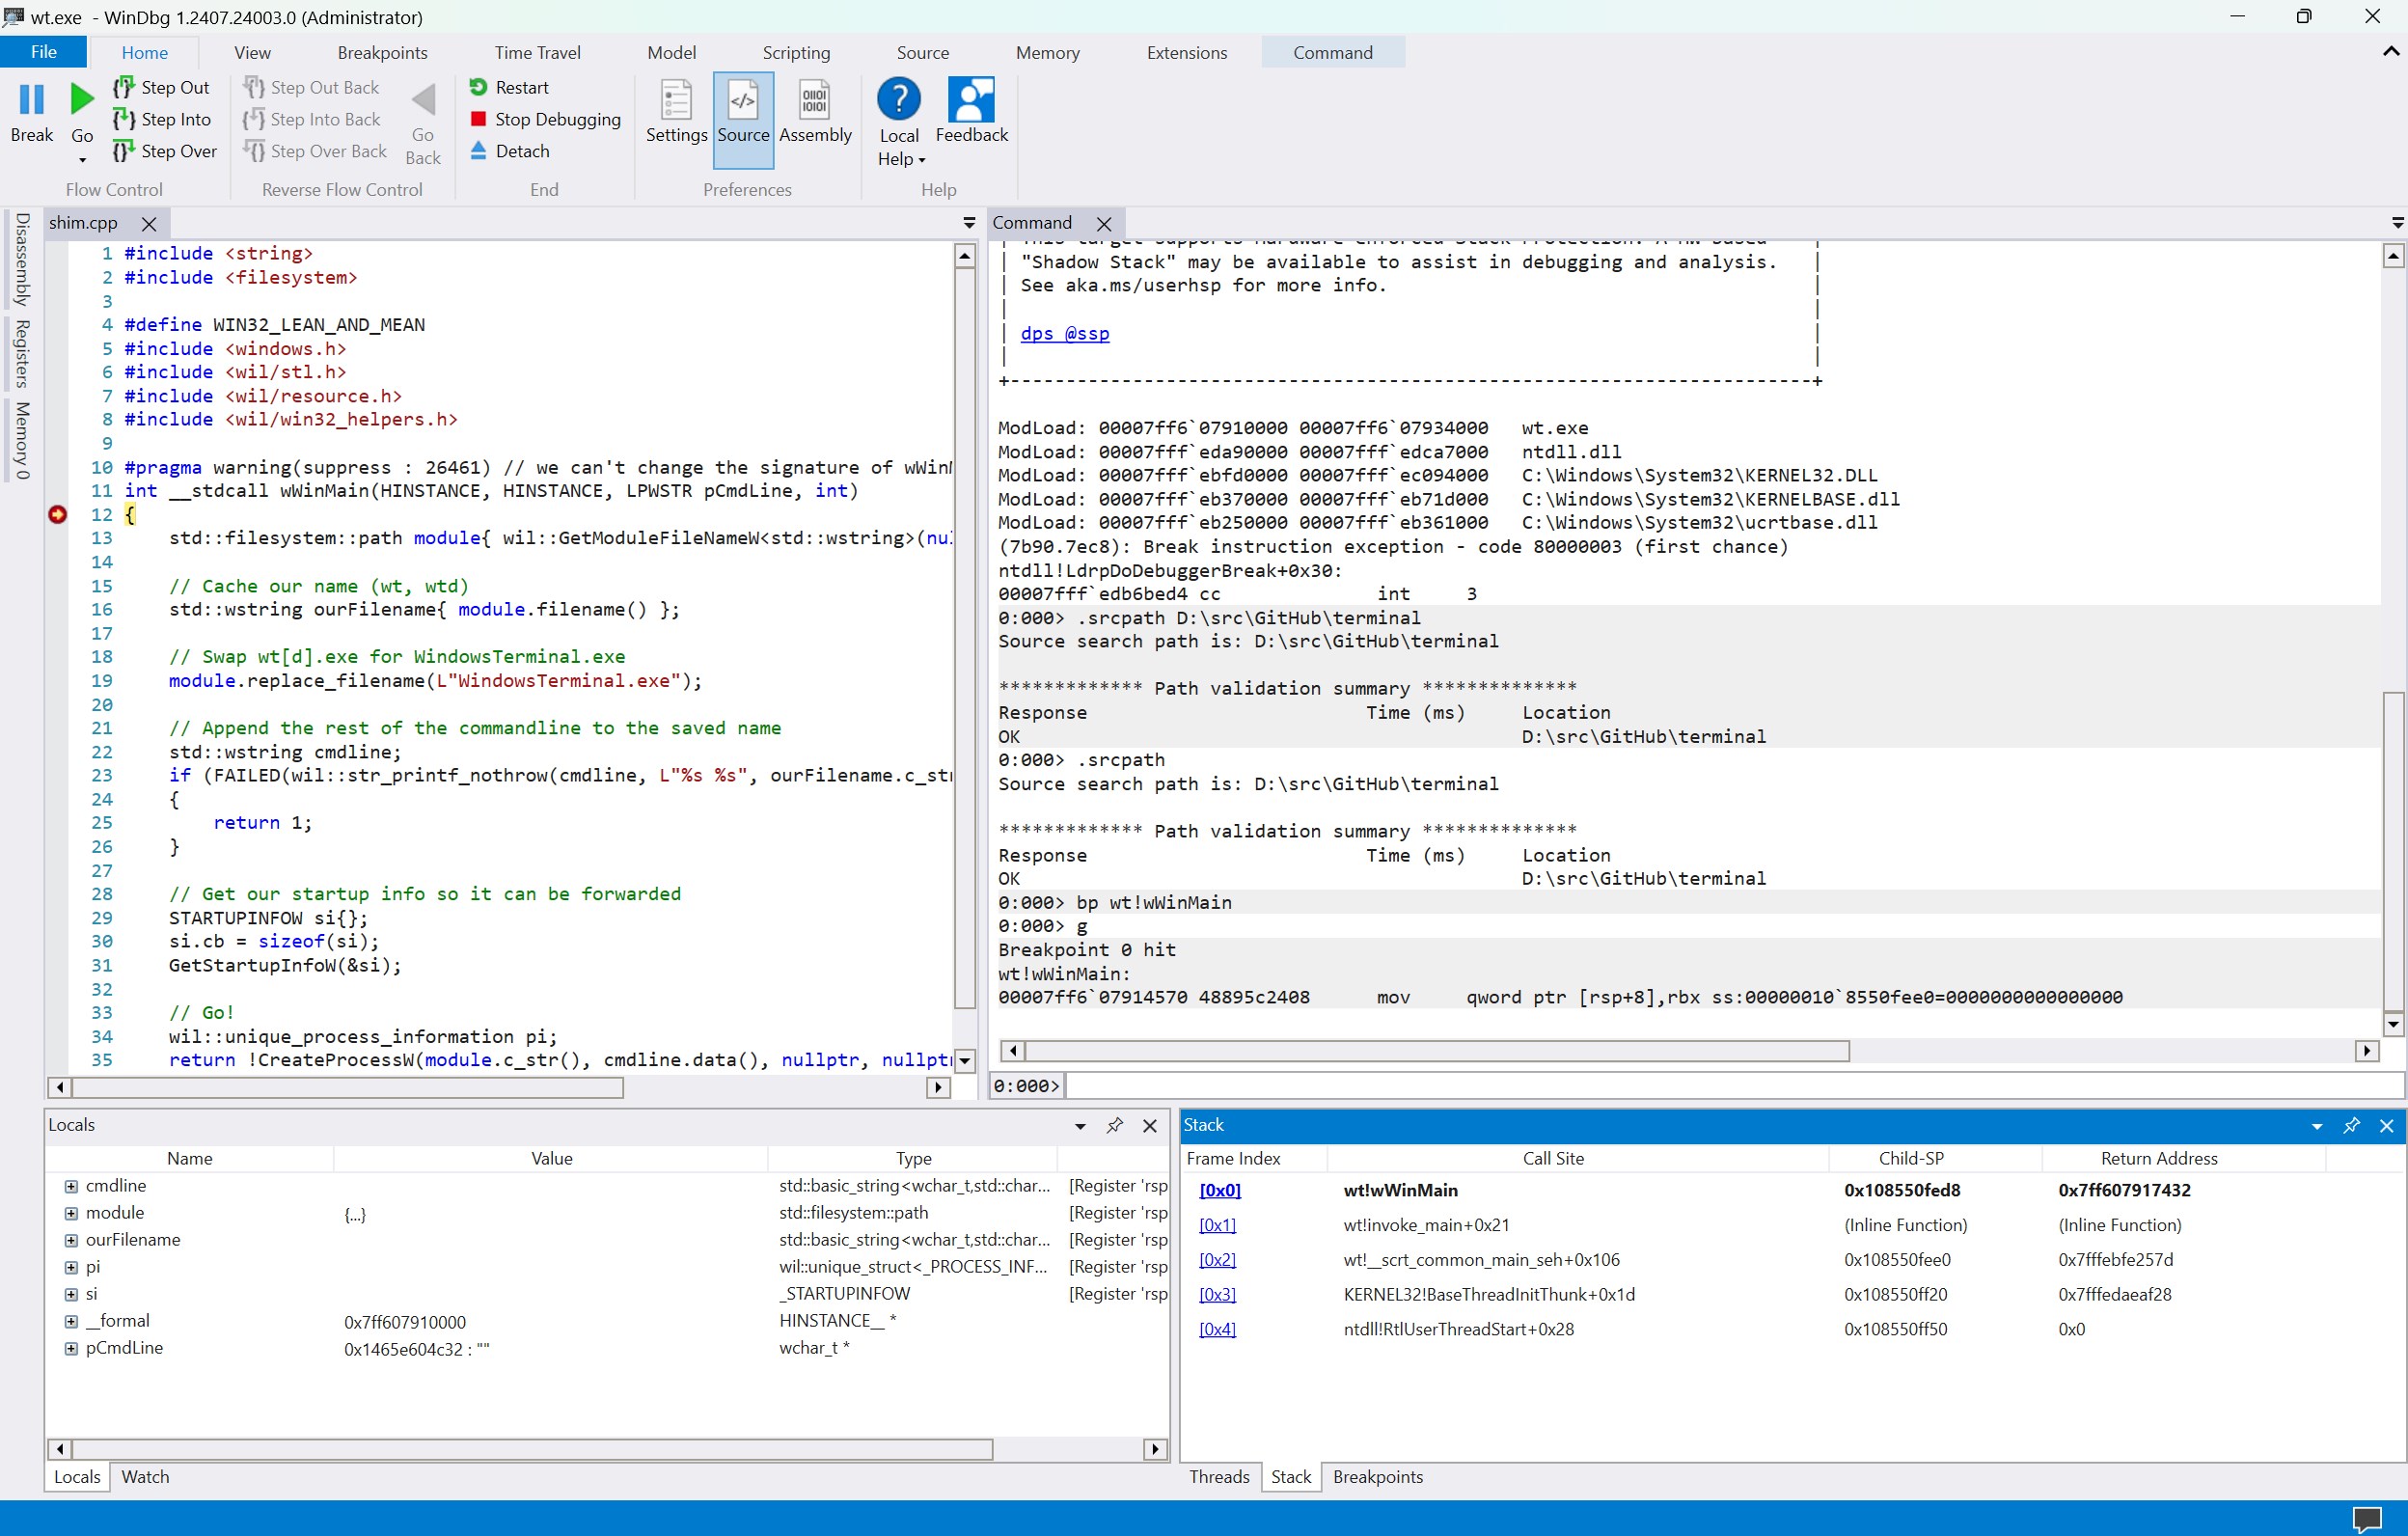
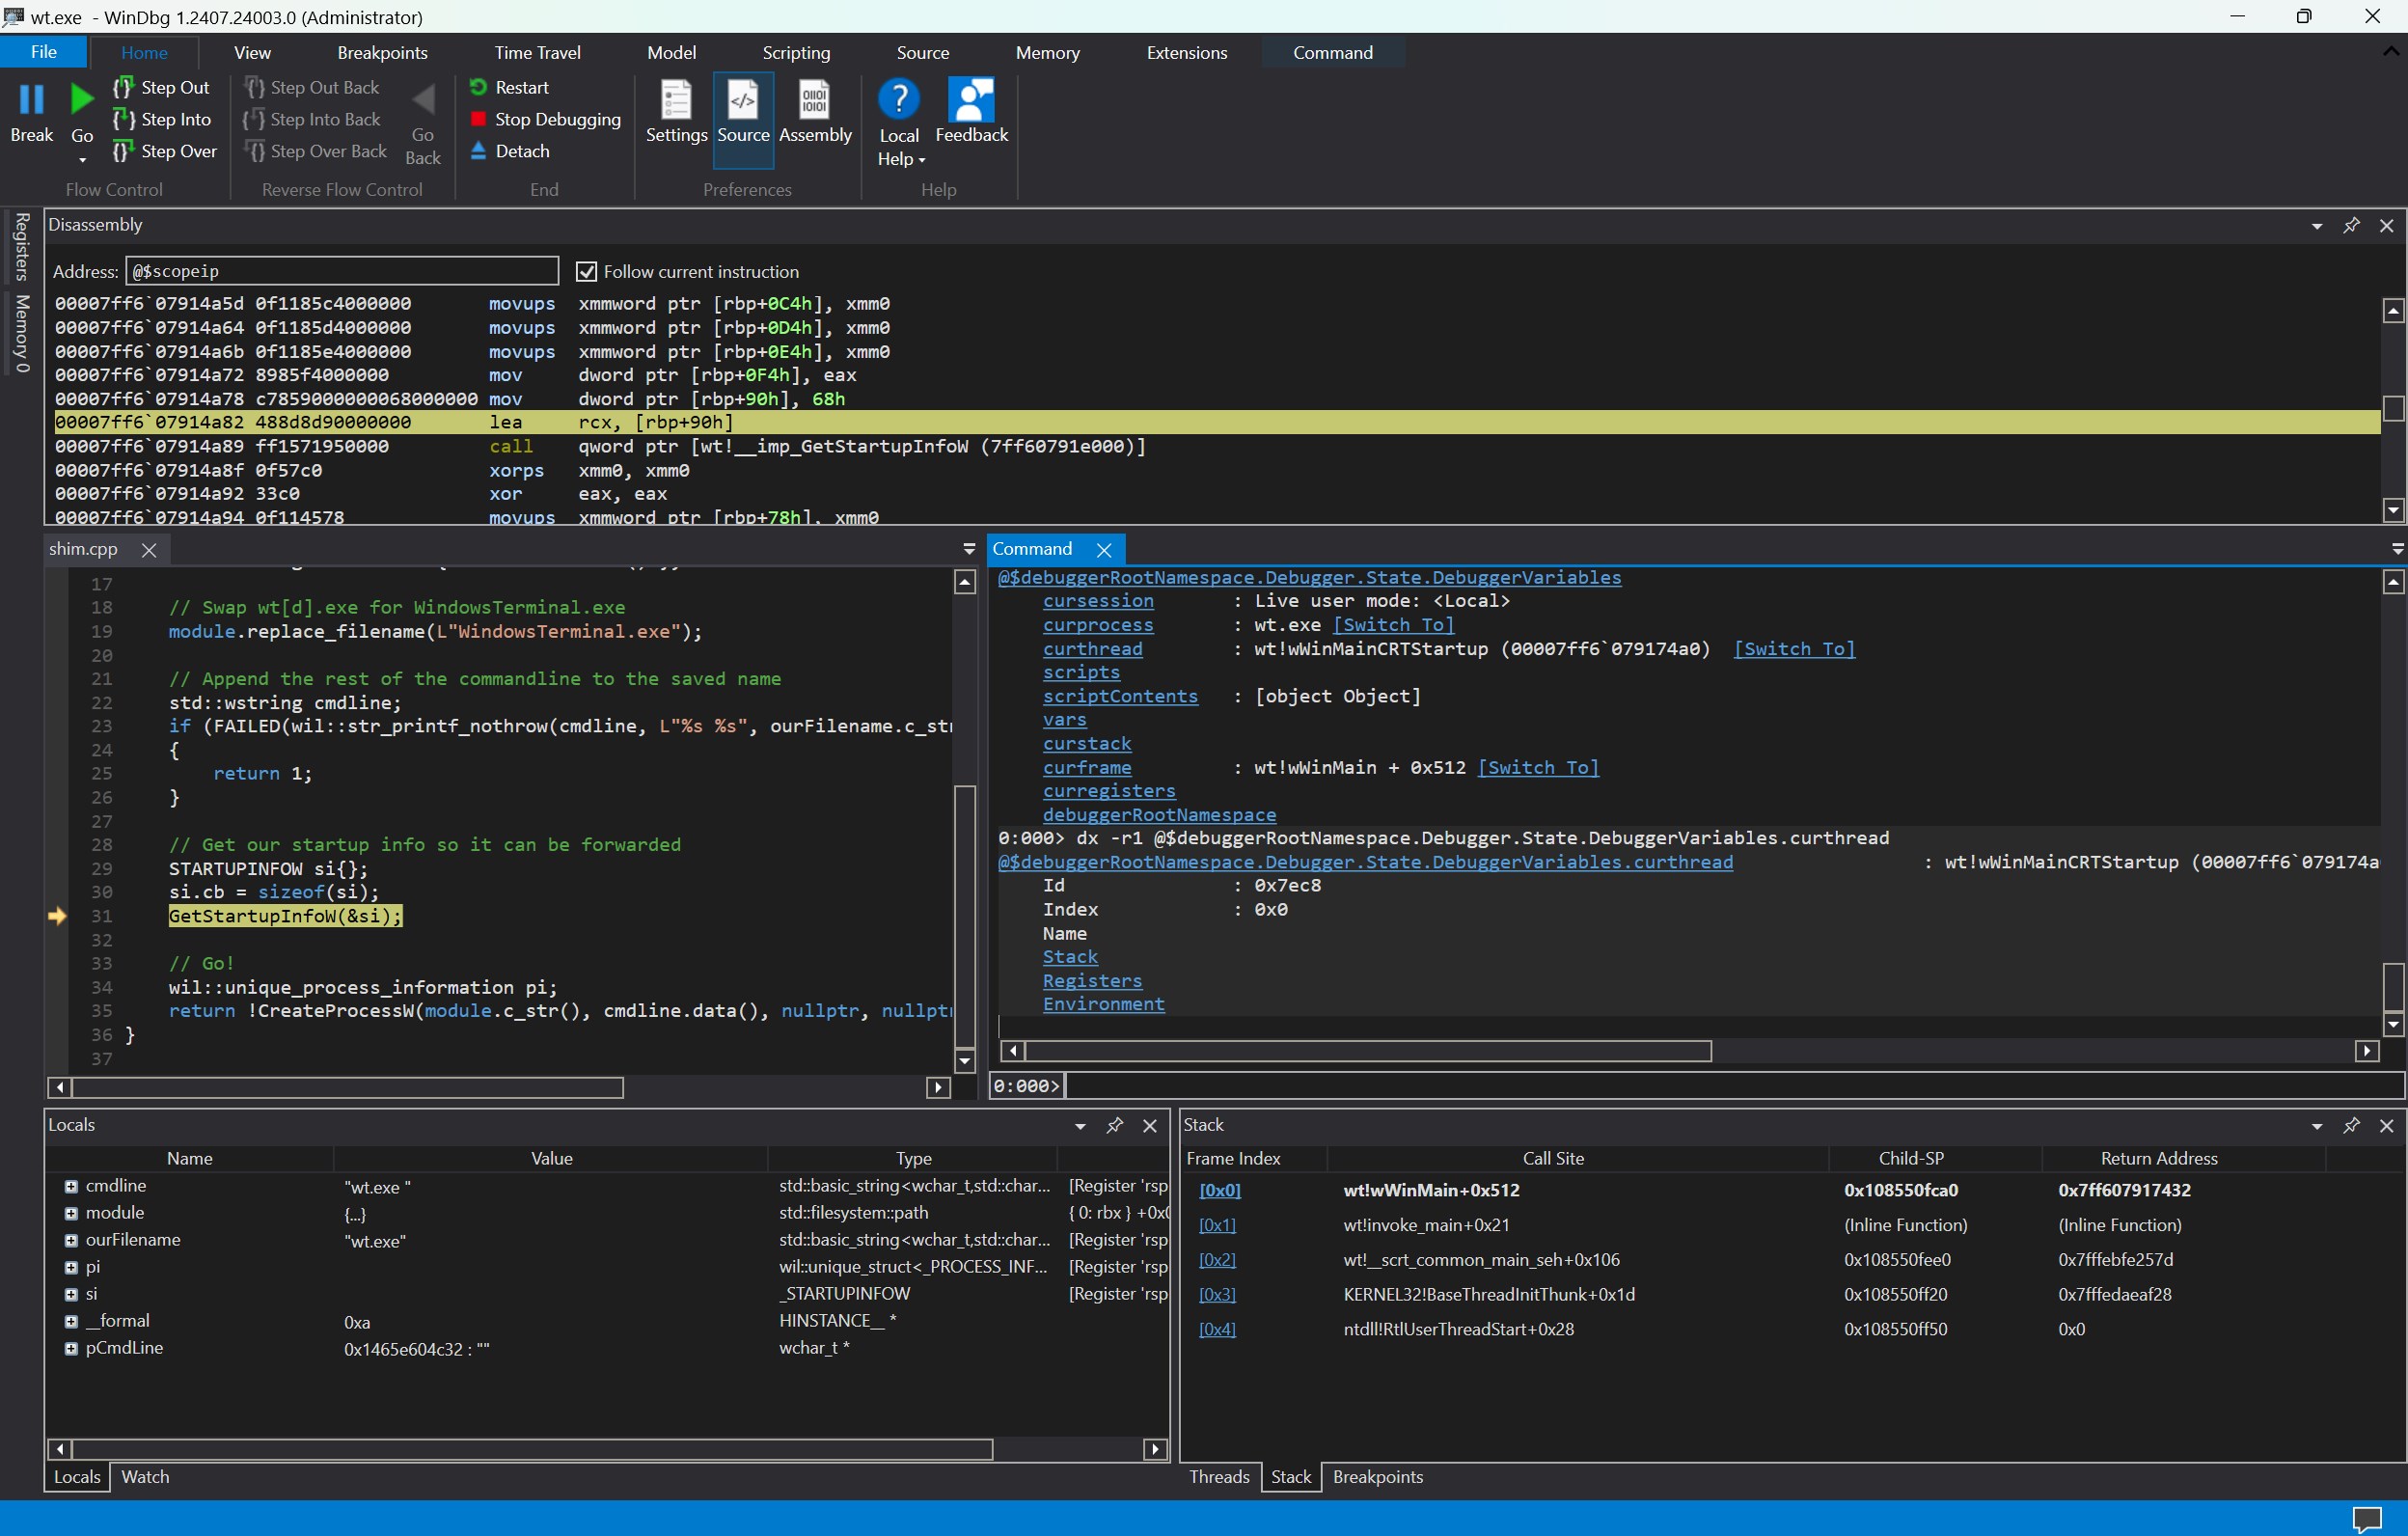
Imagine entering a dense jungle of logs, symbols, and system calls; WinDbg acts like a well-marked trail map. Its interface is streamlined and more visually accessible compared to traditional command-line debugging tools. It provides a logical layout with organized panels showing stack traces, modules, and memory dumps, making navigation smoother. For newcomers, the learning curve might seem daunting at first—like opening a complex machinery manual—but the app's design is much friendlier than some other classic debugging tools. As you familiarize yourself, you'll find it more akin to a well-organized workspace rather than an intimidating labyrinth.
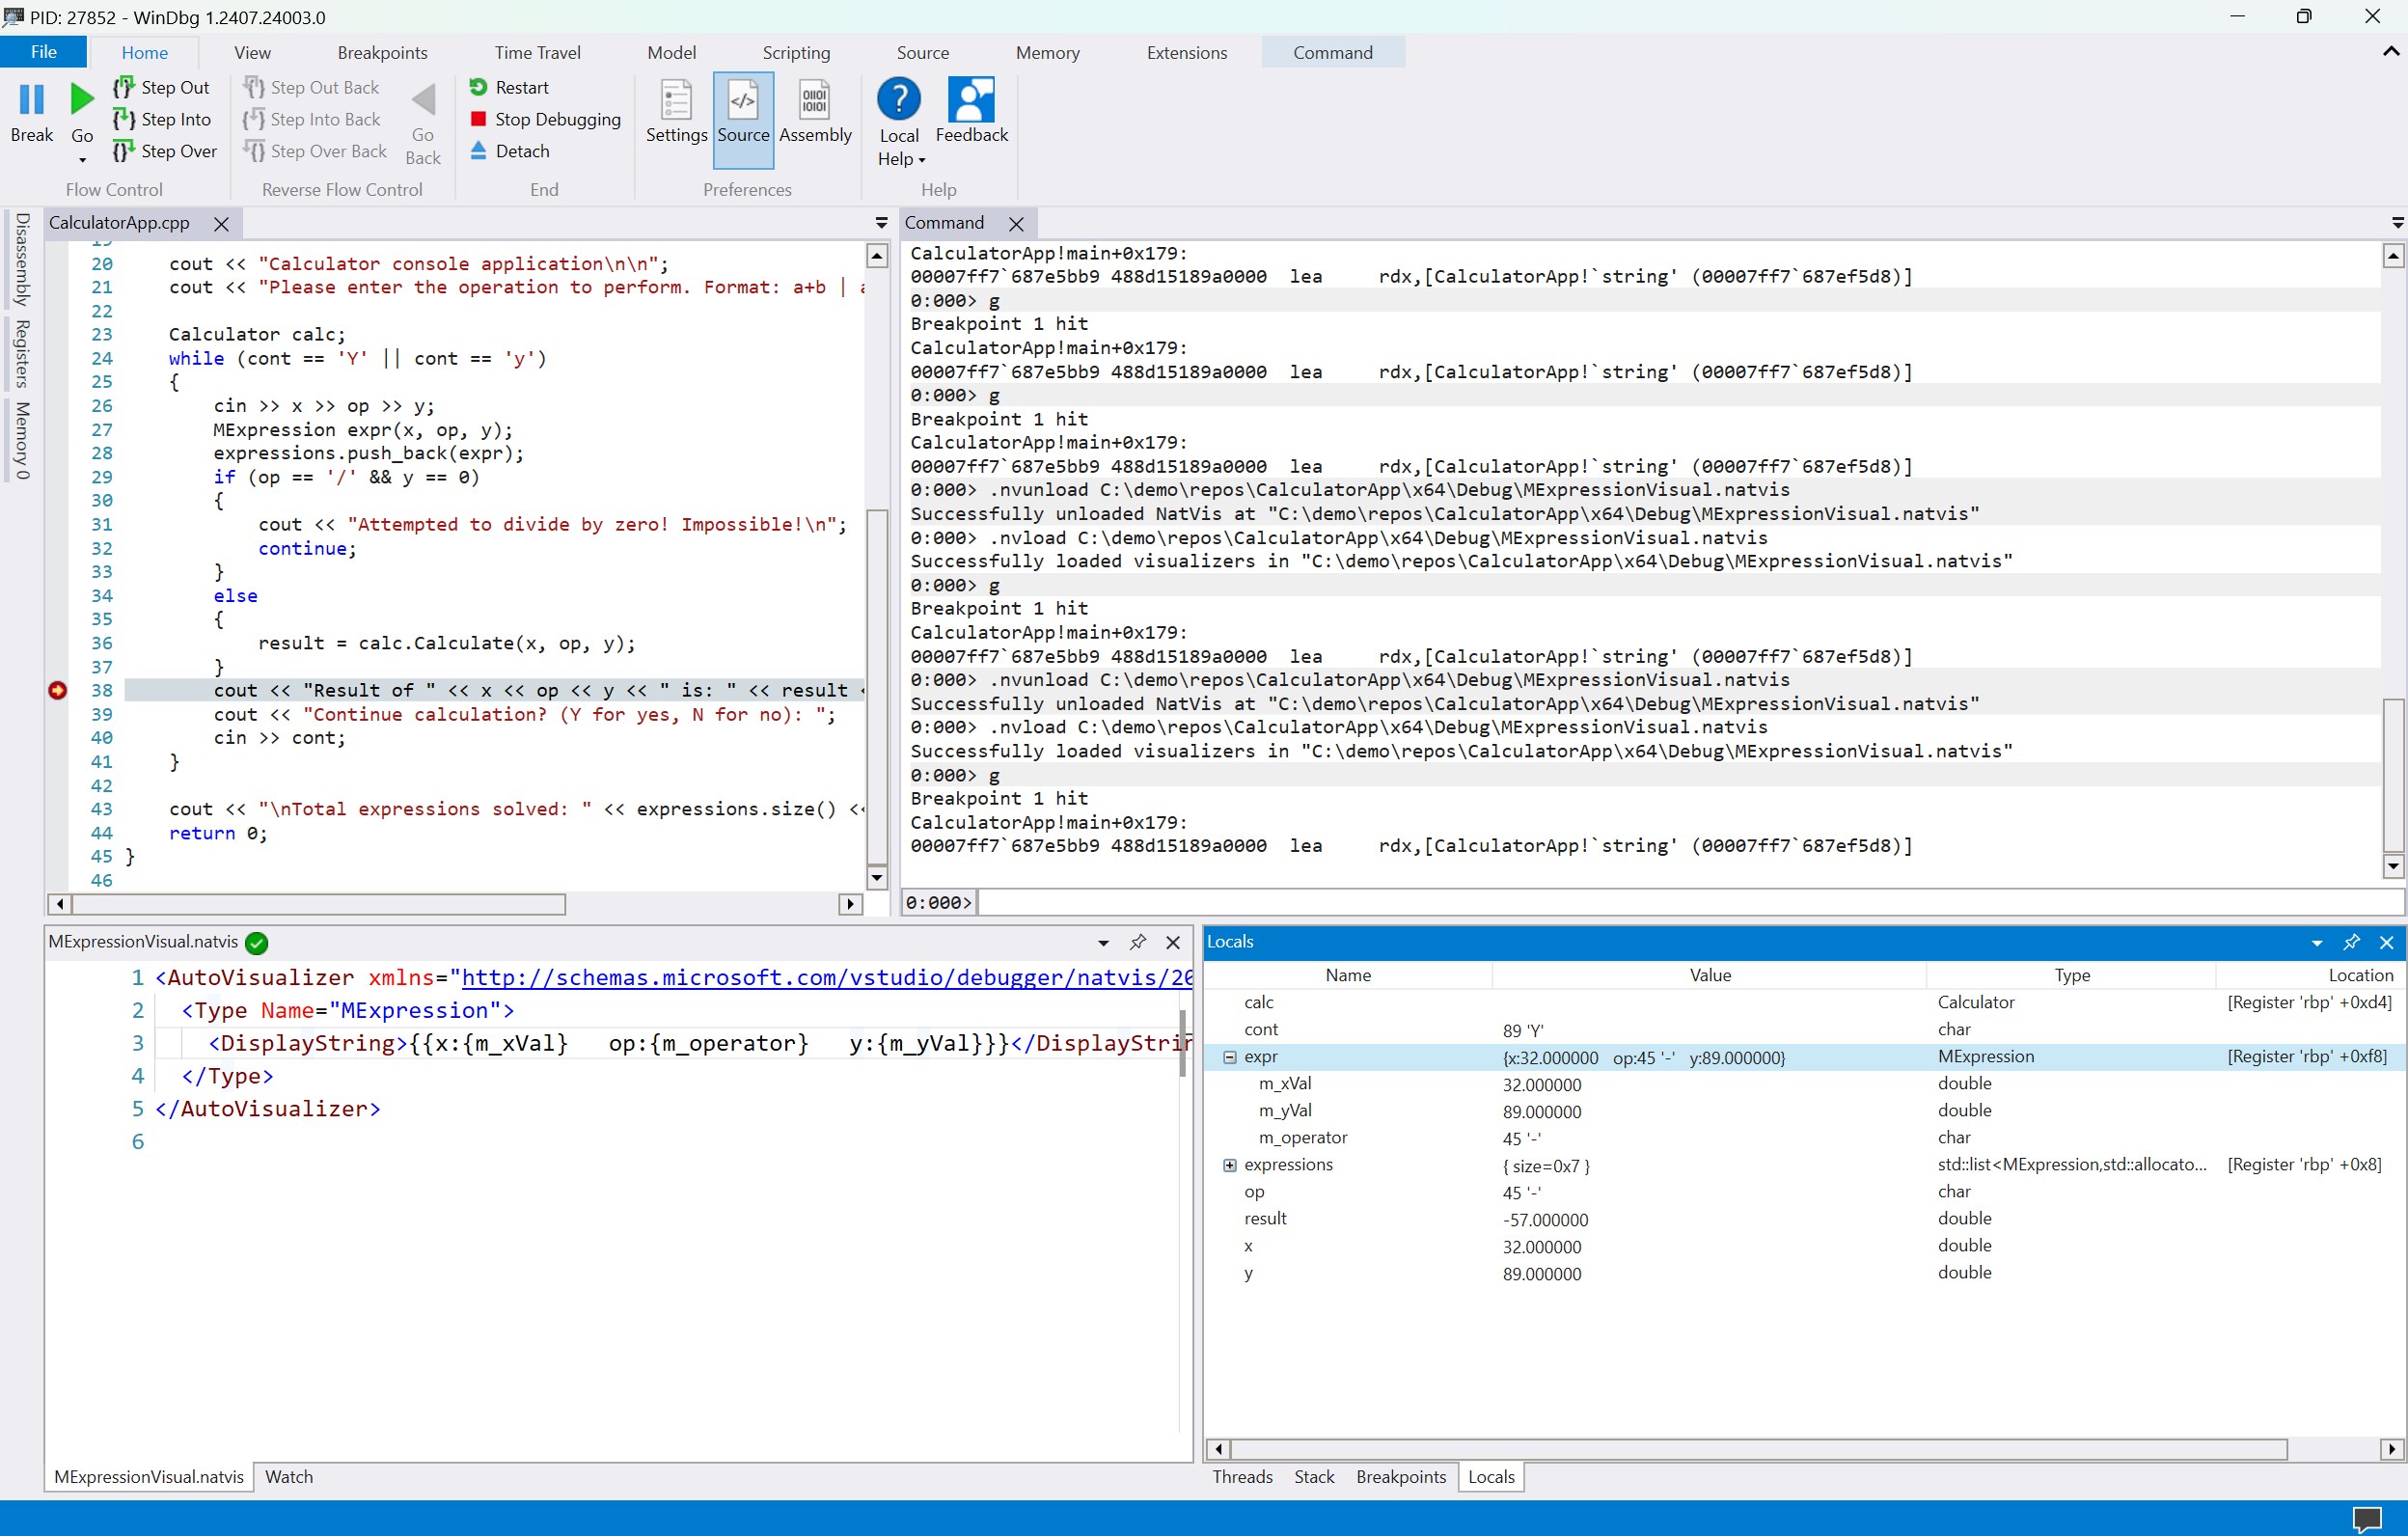
At the heart of WinDbg's appeal are its core functionalities. First, its crash dump analysis capabilities are top-notch, transforming obscure error logs into clear narratives of what went wrong—crucial for diagnosing elusive system crashes. Second, real-time debugging allows developers to attach to live processes, moving fluidly from static analysis to dynamic troubleshooting. Third, the symbol management system is deeply integrated, automatically fetching the latest debug symbols from Microsoft's servers, which magically turns cryptic memory addresses into readable functions and variables.
The most distinctive feature, however, is its integration with modern Windows debugging extensions, which provide richer insights into kernel mode and user mode errors. This synergy empowers professionals to pinpoint issues with precision, saving countless hours compared to manual code reviews or less sophisticated tools.
Engaging with WinDbg for Windows feels almost like having a tooltip-laden map in a complex video game. While the interface is cleaner than traditional versions, mastering it still requires patience—expect a gentle learning curve rather than a sprint. The app runs smoothly on supported devices, with quick response times that keep frustration at bay during intensive debugging sessions. The visual cues, tabbed panels, and context menus enable a logical flow—probably less like navigating a maze and more like following a well-marked trail.
Compared to other developer tools like Visual Studio's debugging features or WinDbg Classic, this version offers a more approachable experience without sacrificing depth—a balance appreciated by those who need both power and usability. Its integration with Windows-specific features ensures that debugging is not only more effective but also more aligned with the latest Windows updates and APIs.
WinDbg for Windows stands out as a particularly potent tool in the debugging landscape, especially with its user-centric interface and comprehensive core features. Its most impressive aspects are the crash dump analysis and seamless symbol integration, which dramatically streamline the troubleshooting process. While it may require some initial investment to master, the app rewards users with detailed insights and efficient workflows. Overall, I recommend it strongly for professionals who need reliable, in-depth debugging capabilities—consider it your reliable sidekick next time Windows throws a fit or crashes at an inopportune moment.
Powerful debugging capabilities
Supports multiple debugging environments
Extensive scripting and automation features
Strong integration with Windows debugging tools
Detailed analysis and visualization of dumps
Steep learning curve
Sparse user-friendly documentation
Limited GUI compared to other GUI-based debuggers
Performance issues with large dump files
Requires a steep system configuration to run optimally

for Windows
 5
5

for Windows
4.6

for Windows
4.6

for Windows
4.6

for Windows
4.5

for Windows
4.4

for Windows
4.4

for Windows
4.3

for Windows
4.3

for Windows
4.3

for Windows
4.3

for Windows
4.2

for Windows
5

for Windows
5
for Windows
5

for Windows
5

for Windows
5

for Windows
5

for Windows
5

for Windows
5

for Windows
5

for Windows
5