Business
Microsoft Corporation
PC
Windows 10 version 17763.0 or higher
Integrated Keyboard
Integrated Mouse
1 GB
English (United States)
Power BI Report Builder for Windows is a dedicated report designing application that empowers users to craft detailed, professional reports seamlessly. Developed and published by Microsoft Corporation, this tool integrates tightly with the Power BI ecosystem, making complex data visualization accessible for both technical and business users alike.
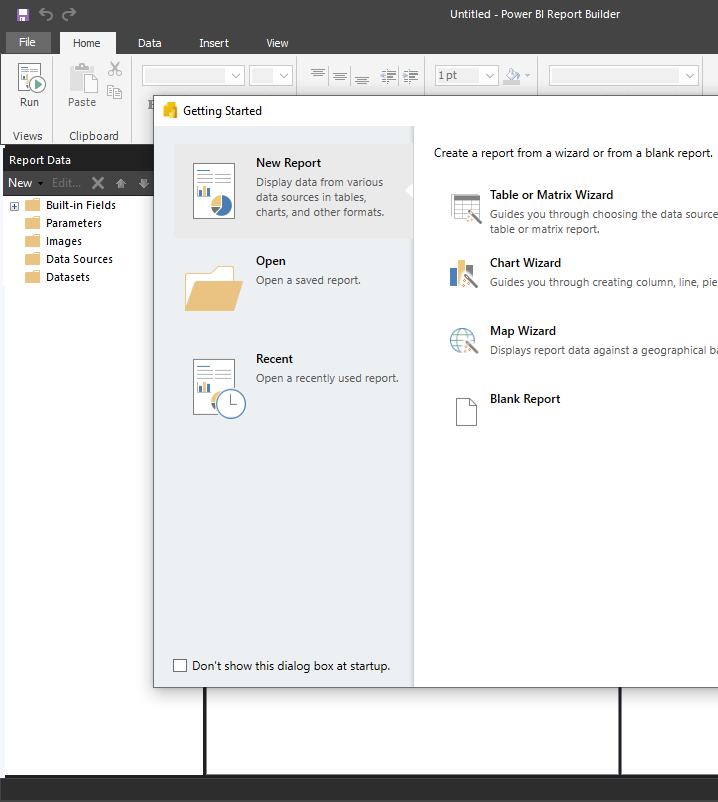
At its heart, Power BI Report Builder emphasizes ease of use combined with powerful capabilities. Key highlights include a robust report creation interface supporting pixel-perfect report layouts, integration with diverse data sources for flexible data manipulation, and intuitive tools for defining complex report parameters. Additionally, the application offers a rich set of visualization options and the ability to export reports in various formats, supporting comprehensive reporting needs.
This application is ideal for business analysts, data professionals, and project managers who require custom report solutions beyond typical dashboards. Power BI Report Builder distinguishes itself with its focus on pixel-perfect reporting and seamless integration with existing Microsoft products like SQL Server Reporting Services and Power BI Service. Its collaborative work features, including shared report templates and version control, empower teams to work on reports collectively without losing consistency or coherence—a notable edge over some standalone reporting tools.
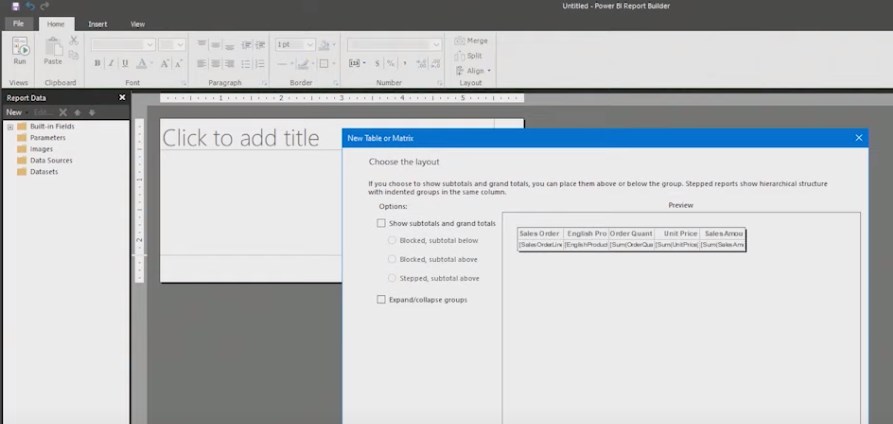
Using Power BI Report Builder is akin to being handed a high-precision drafting table where each element is meticulously aligned for clarity and visual appeal. The interface resembles a familiar Windows environment—organized, clean, and user-friendly—making the learning curve gentle for those already acquainted with basic report concepts. Drag-and-drop functionalities and guided workflows make report creation feel as natural as assembling a puzzle, where each piece fits perfectly and contributes to a cohesive whole. The software responds smoothly to inputs, with minimal lag, providing a fluid experience that encourages experimentation and iteration.
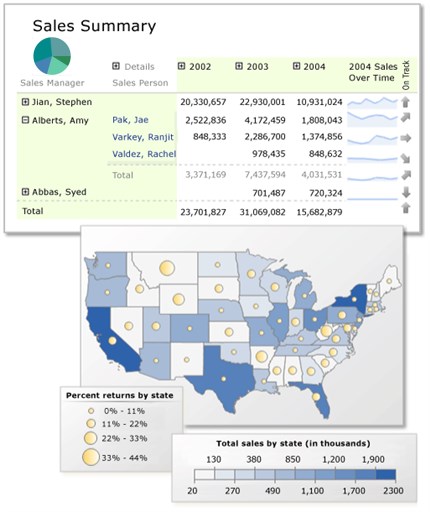
Power BI Report Builder excels in its report layout capabilities. It offers a rich palette of visual components—tables, charts, gauges, and images—that can be meticulously arranged to craft pixel-perfect reports. Users can define complex groupings, calculations, and expressions, all within an interface that resembles a professional studio. This flexibility allows for tailored reporting that meets specific business requirements, whether for operational summaries or strategic dashboards.
One of the application's key strengths lies in its ability to connect to a multitude of data sources, including SQL Server, Analysis Services, Excel, and more. Once connected, users can seamlessly query and manipulate data, applying parameters, filters, and aggregations as needed. This connectivity ensures up-to-date, dynamic reports that reflect real-time insights, making it more than just a static presentation tool but a vital part of data-driven decision-making.
Unlike some standalone reporting tools, Power BI Report Builder offers collaborative functionalities such as shared report templates and version control, ensuring teams can work synchronously on report development. What's particularly notable is its integration with the Power BI ecosystem, facilitating straightforward publishing and sharing of reports across organizational channels. This fosters a collaborative environment where insights are co-created and refined iteratively, enhancing overall productivity and report consistency.
Overall, Power BI Report Builder for Windows stands out as a capable, user-friendly, and feature-rich reporting tool. Its strength lies in offering precise control over report layouts combined with flexible data integration and collaborative features. While it may involve a modest learning curve for newcomers, its intuitive interface and seamless Microsoft ecosystem integration make it a worthwhile choice for professionals seeking high-quality, customizable reports. I'd recommend it confidently for corporate environments that prioritize accuracy, clarity, and teamwork in their reporting processes. For those already invested in the Microsoft data universe, it's an especially compelling addition to your toolkit.
Intuitive report designing interface
Seamless integration with Microsoft ecosystem
Rich visualization options
Customizable report parameters
Free to use with existing Microsoft licenses
Limited advanced analytics features
Performance issues with large datasets
Steeper learning curve for new users
Limited export format options
Dependence on Microsoft ecosystem

for Windows
 5
5

for Windows
5

for Windows
4.9

for Windows
4.9

for Windows
4.9

for Windows
4.9
for Windows
4.8

for Windows
4.8

for Windows
4.8

for Windows
4.8

for Windows
4.7

for Windows
4.7

for Windows
5

for Windows
5

for Windows
5

for Windows
5

for Windows
5

for Windows
5
for Windows
5

for Windows
5

for Windows
5

for Windows
5