Menu
Power BI Desktop

Power BI Desktop

4.8
Advertisement

Information

Category:

Business

Available on:

PC

OS:

Windows 10 version 17134.0 or higher

Memory:

Not specified

Languages:

Basque, Bulgarian, Catalan, Chinese (Simplified), Chinese (Traditional), Croatian, Czech, Danish, Dutch, English (United States), Estonian, Finnish, French, Galician , German, Greek, Hindi, Hungarian, Indonesian, Italian, Japanese, Kazakh, Korean , Latvian, Lithuanian, Malay, Norwegian (Bokmål), Polish , Portuguese (Brazil), Portuguese (Portugal), Romanian, Russian, Serbian, Serbian (Latin, Serbia), Slovak, Slovenian (Slovenia), Spanish (Spain), Swedish, Thai, Turkish, Ukrainian, Vietnamese

Advertisement

Overview

Power BI Desktop for Windows: A Deep Dive into Data Visualization Power Power BI Desktop for Windows, developed by Microsoft Corporation, is a robust data visualization tool designed to turn complex data sets into compelling insights. Whether you're a business analyst, data scientist, or decision-maker, this application promises to be your visual storytelling companion, enabling smarter decisions through interactive dashboards and reports. **A Spark of Innovation in the Business Intelligence Realm** Microsoft Corporation, a global leader in software solutions, brings its extensive expertise into Power BI Desktop. The app's primary strengths lie in its rich interactivity, seamless integration with Microsoft 365 ecosystem, and advanced data modeling capabilities. Users can craft dynamic dashboards, perform advanced analytics, and share insights effortlessly. The target audience primarily includes data professionals, corporate teams, and small to medium-sized enterprises seeking an accessible yet powerful analytics platform to elevate their data-driven culture. **Embarking on a Journey Through Data** Stepping into Power BI Desktop feels akin to entering a high-tech cockpit, where every control and display is designed for intuitive data mastery. As a user, you'll feel enveloped by a user-friendly interface that balances sophistication with approachability. The application's design reduces the initial intimidation often linked with complex BI tools, making it accessible for newcomers while enriching capabilities for seasoned analysts. **Harnessing the Core Strengths: Interactive Data Modeling and Collaborative Features** One of Power BI's standout features is its ability to create richly interactive dashboards. Imagine building a cockpit where clicking on a sales region dynamically updates all related charts and KPIs—this is the power of its interactivity. The interface makes it straightforward to drag-and-drop data fields, craft custom visuals, and implement filters that allow stakeholders to explore data from multiple angles, fostering a culture of self-service analytics within organizations. Another compelling aspect is Power BI's collaborative capabilities. Unlike traditional desktop-only tools, Power BI Desktop integrates seamlessly with Power BI Service, enabling real-time sharing and collaboration. Teams can comment, annotate, and co-author reports, which streamlines communication and decision-making. This feature positions Power BI as not just a visualization tool but a hub for teamwork—much like having a collaborative workspace where ideas are visualized, discussed, and refined together. **Design, Performance, and the Learning Curve: User Experience Assessment** Visually, Power BI Desktop exudes clarity with its modern, ribbon-driven interface, reminiscent of familiar Office applications, which minimizes the learning curve. The design emphasizes ease of access: integrating data sources, applying transformations, and creating visuals are all logically structured, helping users become productive with minimal frustration. In terms of operational smoothness, Power BI Desktop performs admirably. Handling large datasets can be resource-intensive, but with optimized queries and hardware support, users can experience fluid transitions between views and swift report refreshes. The learning curve is moderate—while for absolute beginners it might take some time to master advanced features like complex DAX expressions, the abundant online resources, tutorials, and community support significantly ease this hurdle. When compared to similar enterprise BI tools like Tableau or QlikView, Power BI's integration with Microsoft 365 and Office tools emerges as a major differentiator. Its collaborative features are particularly strong, enabling team-based workflows that emulate the collaborative spirit of Google Docs or Microsoft Teams, setting it apart from competitors that treat reporting as a more isolated task. **Recommendation and Practical Usage** Given its balanced blend of user-friendliness, powerful features, and collaborative tools, Power BI Desktop earns a well-deserved recommendation for organizations or individuals serious about data visualization. It's especially suitable if your team already operates within the Microsoft ecosystem or aims to foster a collaborative data culture. For those looking for a free, intuitive entry point into business intelligence, Power BI Desktop is an excellent choice—think of it as the Swiss Army knife for data storytelling. In conclusion, Power BI Desktop for Windows stands out as a compelling, approachable, and collaborative data visualization solution. Its intuitive design paired with the most distinctive feature—the seamless collaborative work environment—make it a noteworthy tool in the modern data landscape. Whether you're starting your data journey or refining complex analytics pipelines, this application offers a comprehensive platform to bring your insights to life.

pros

User-Friendly Interface

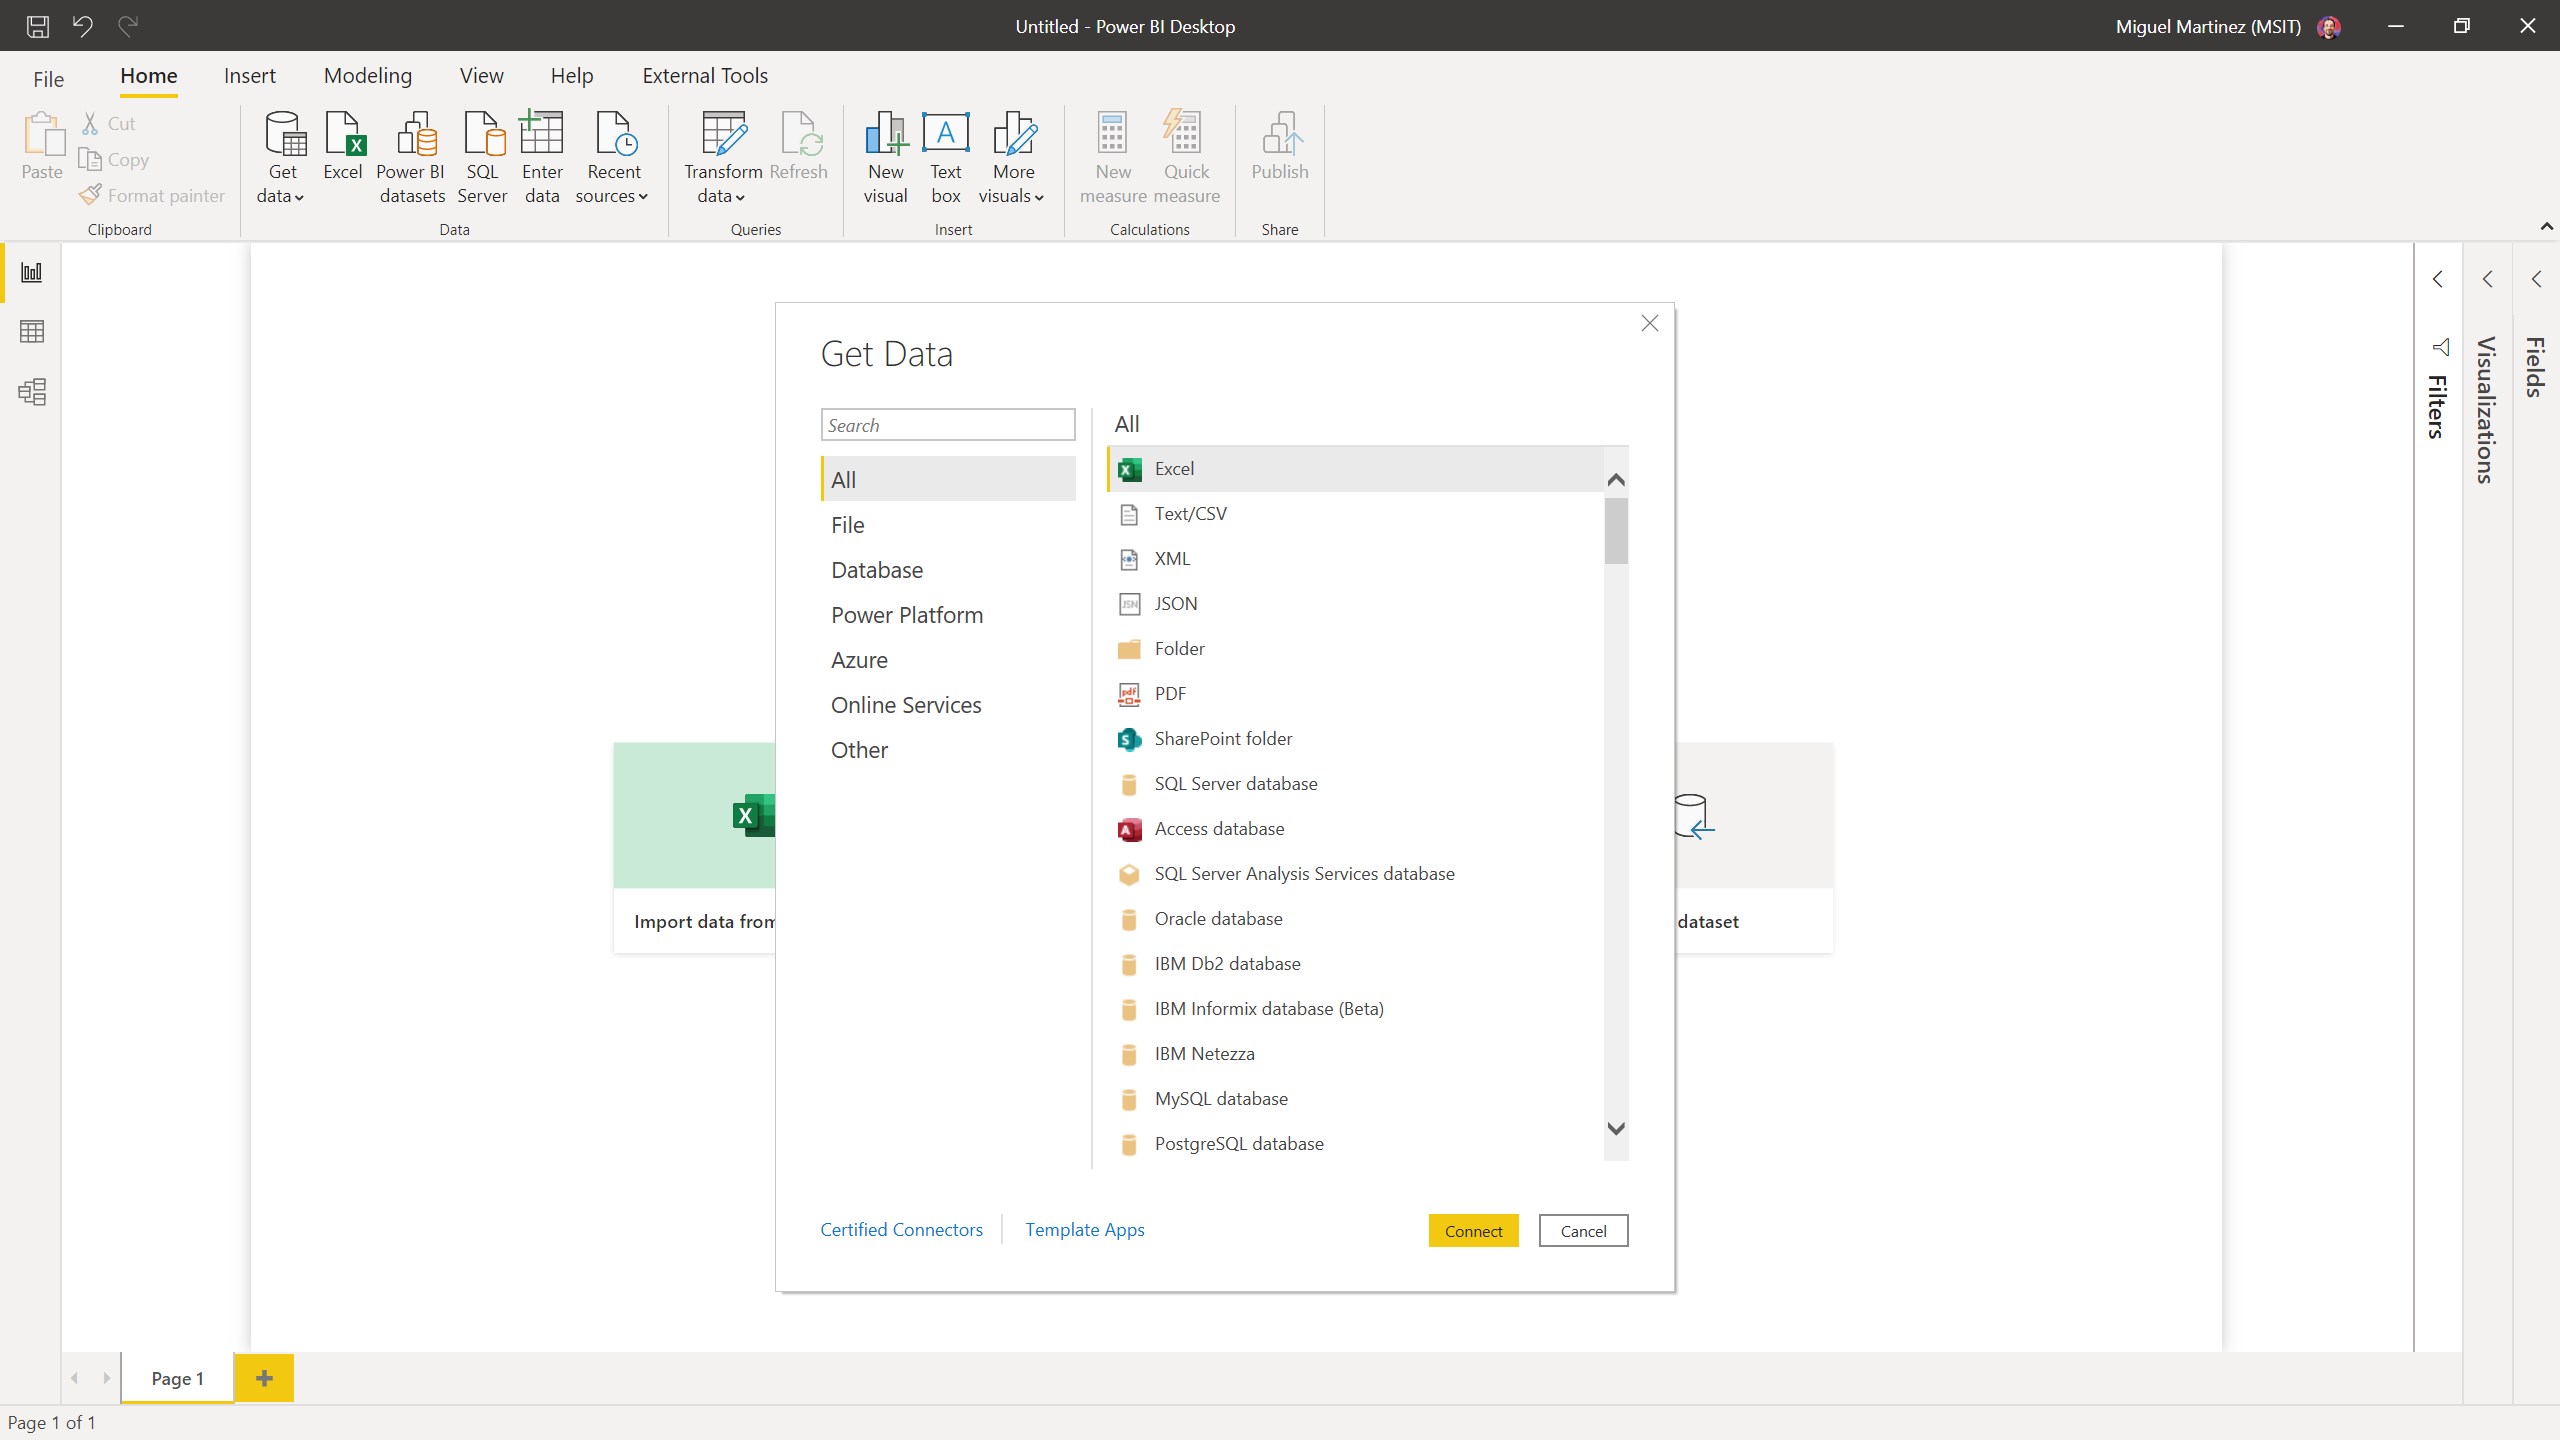
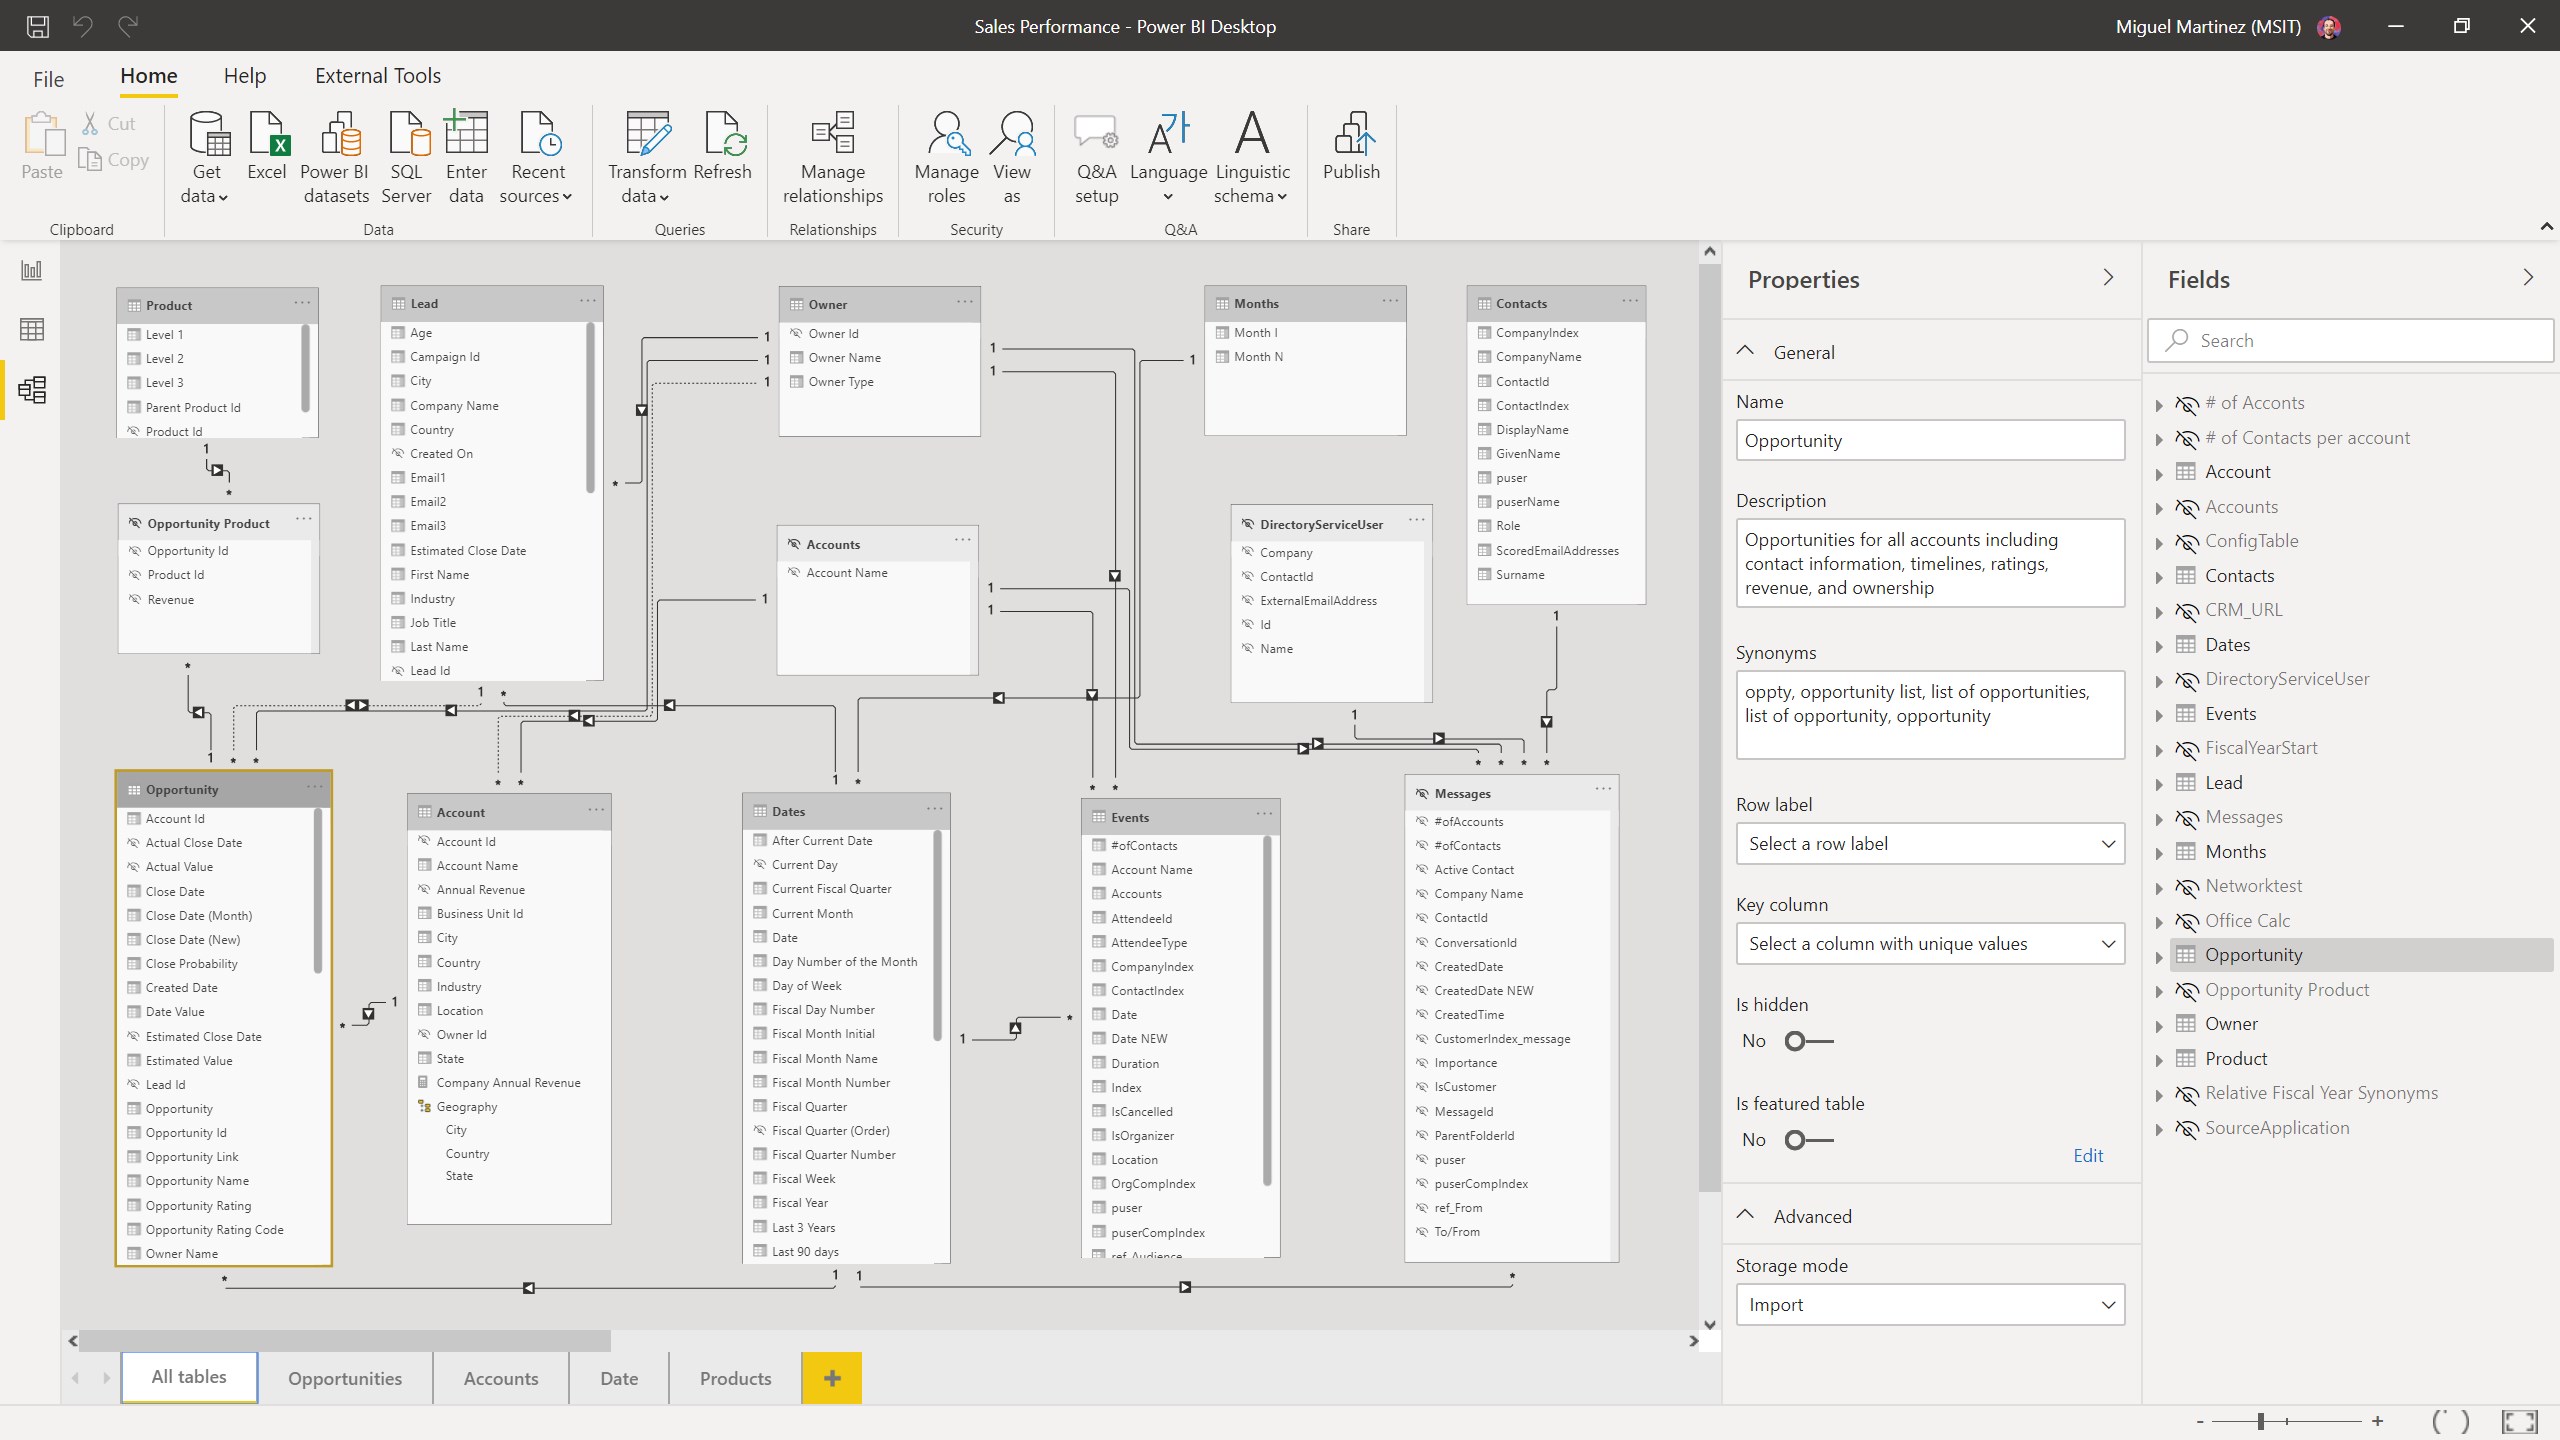
Strong Data Integration

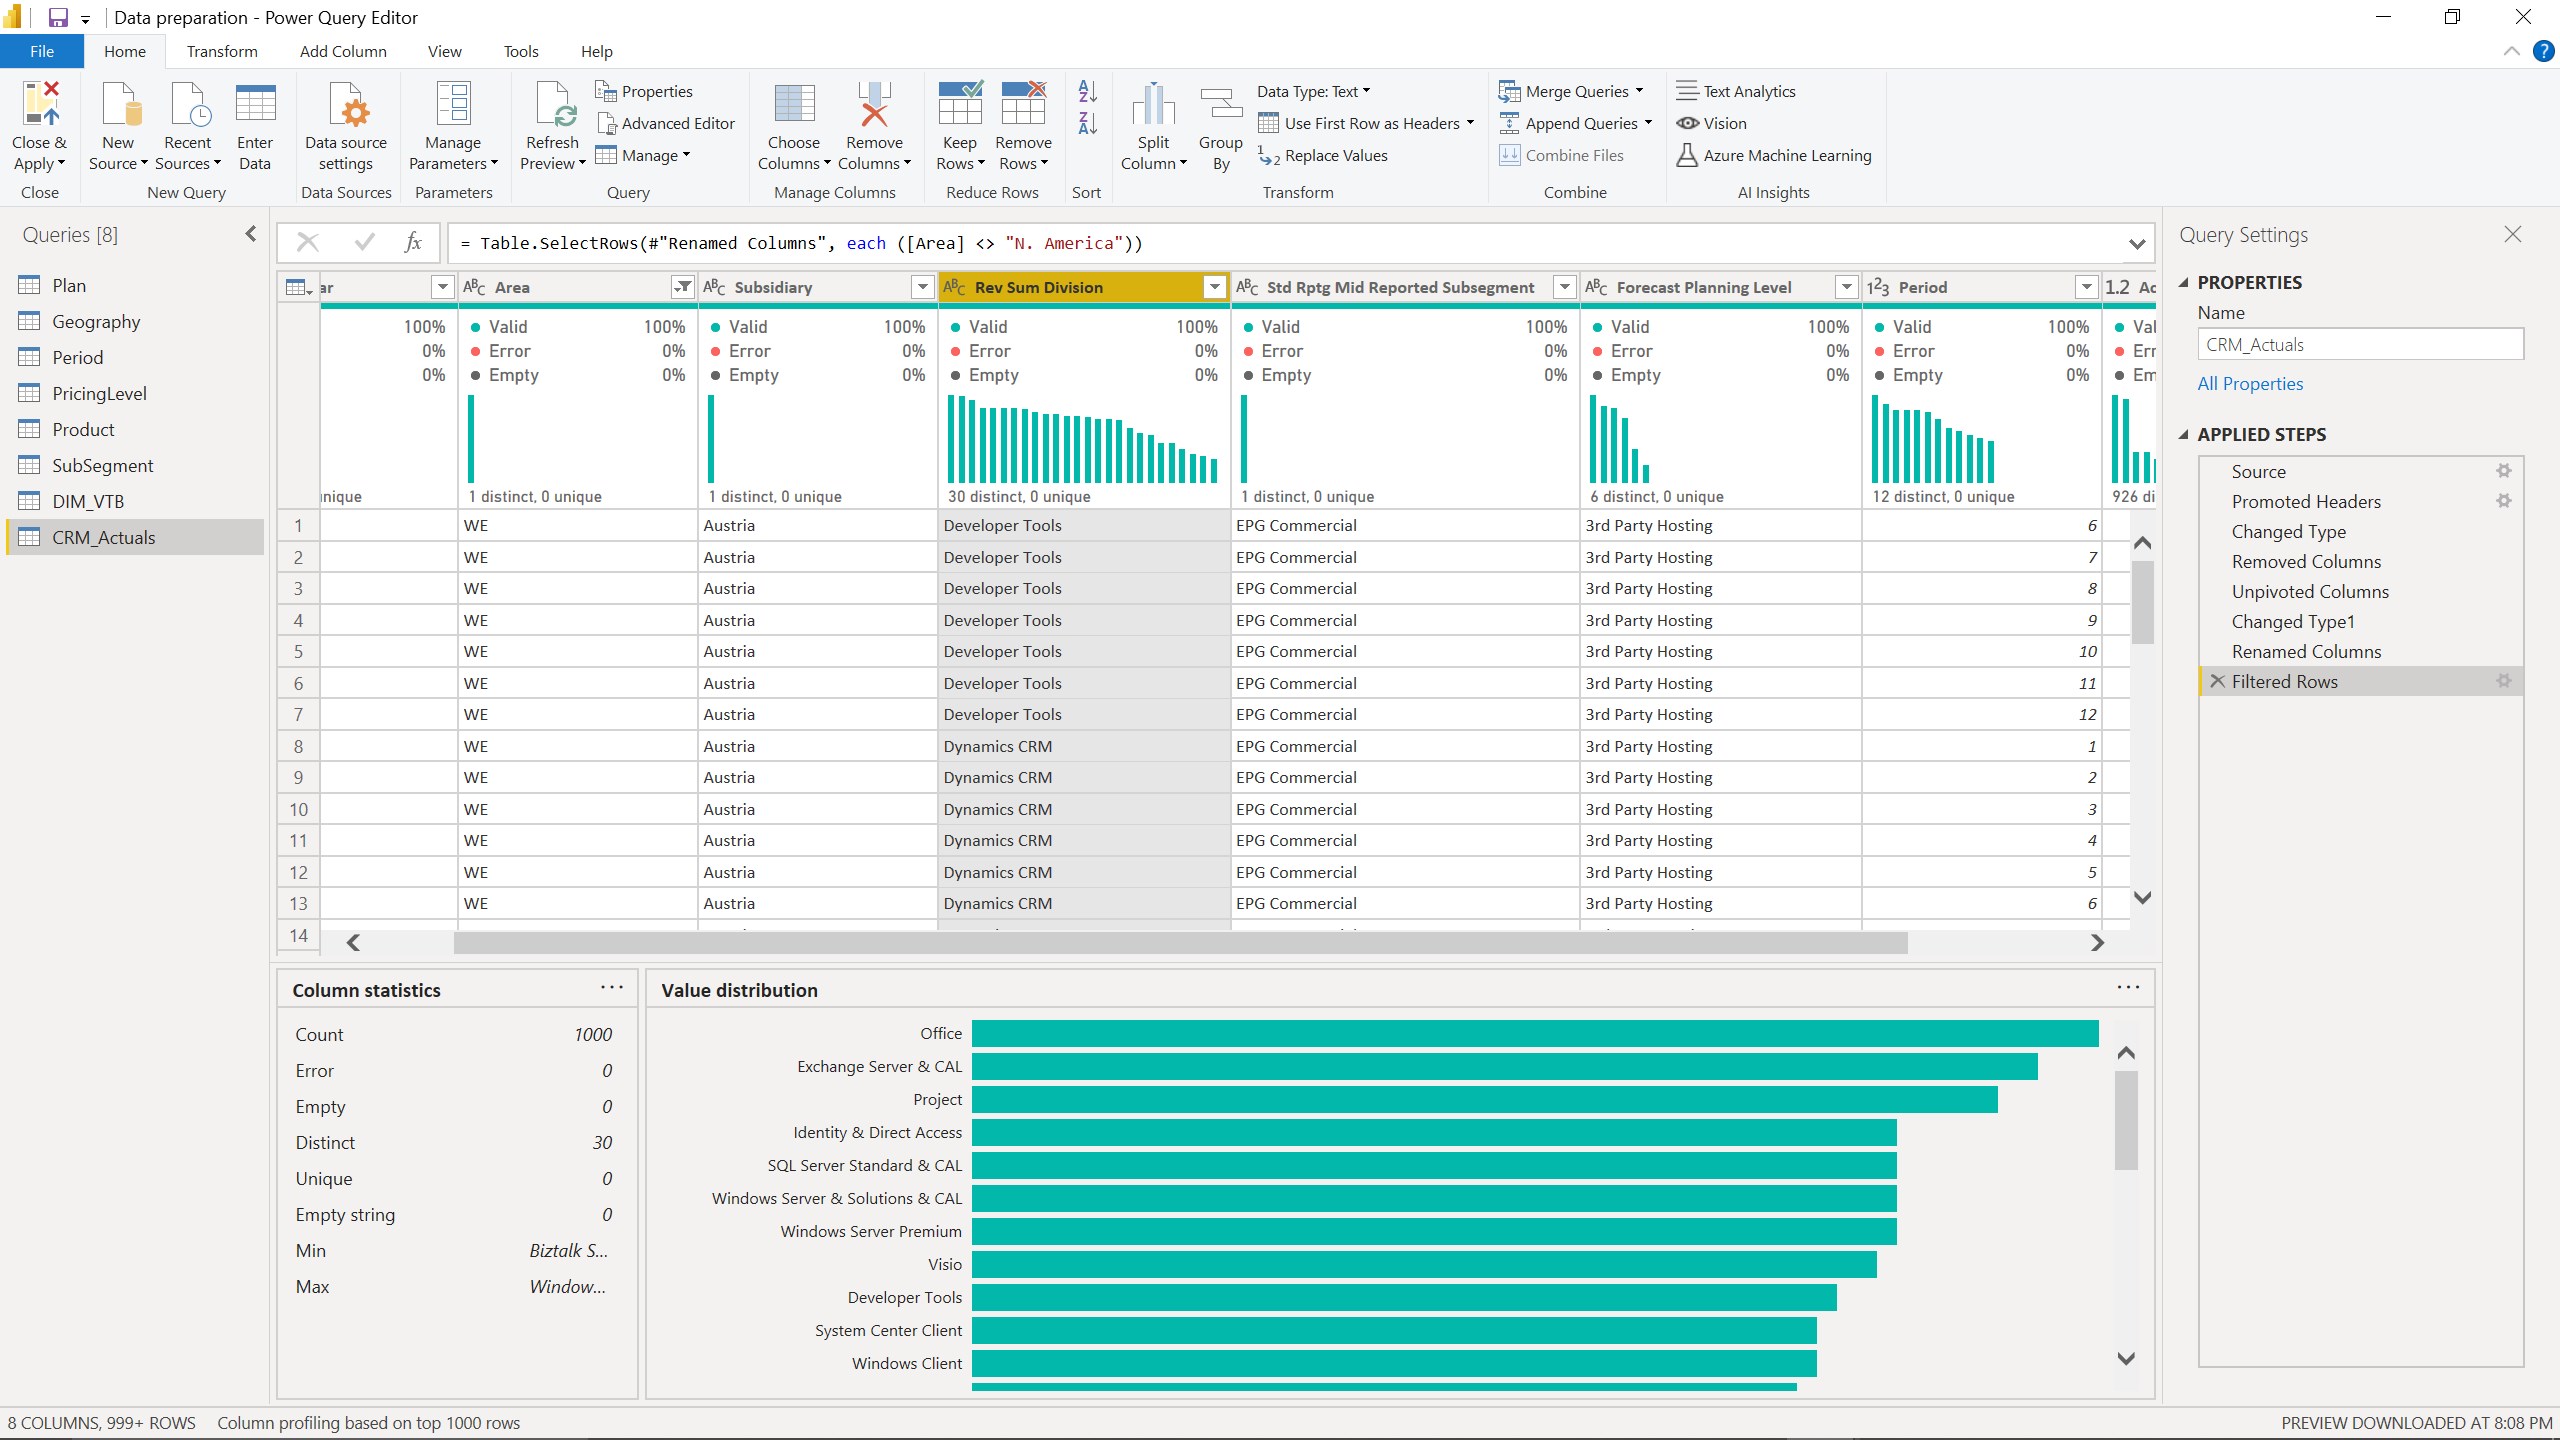
Advanced Data Modeling

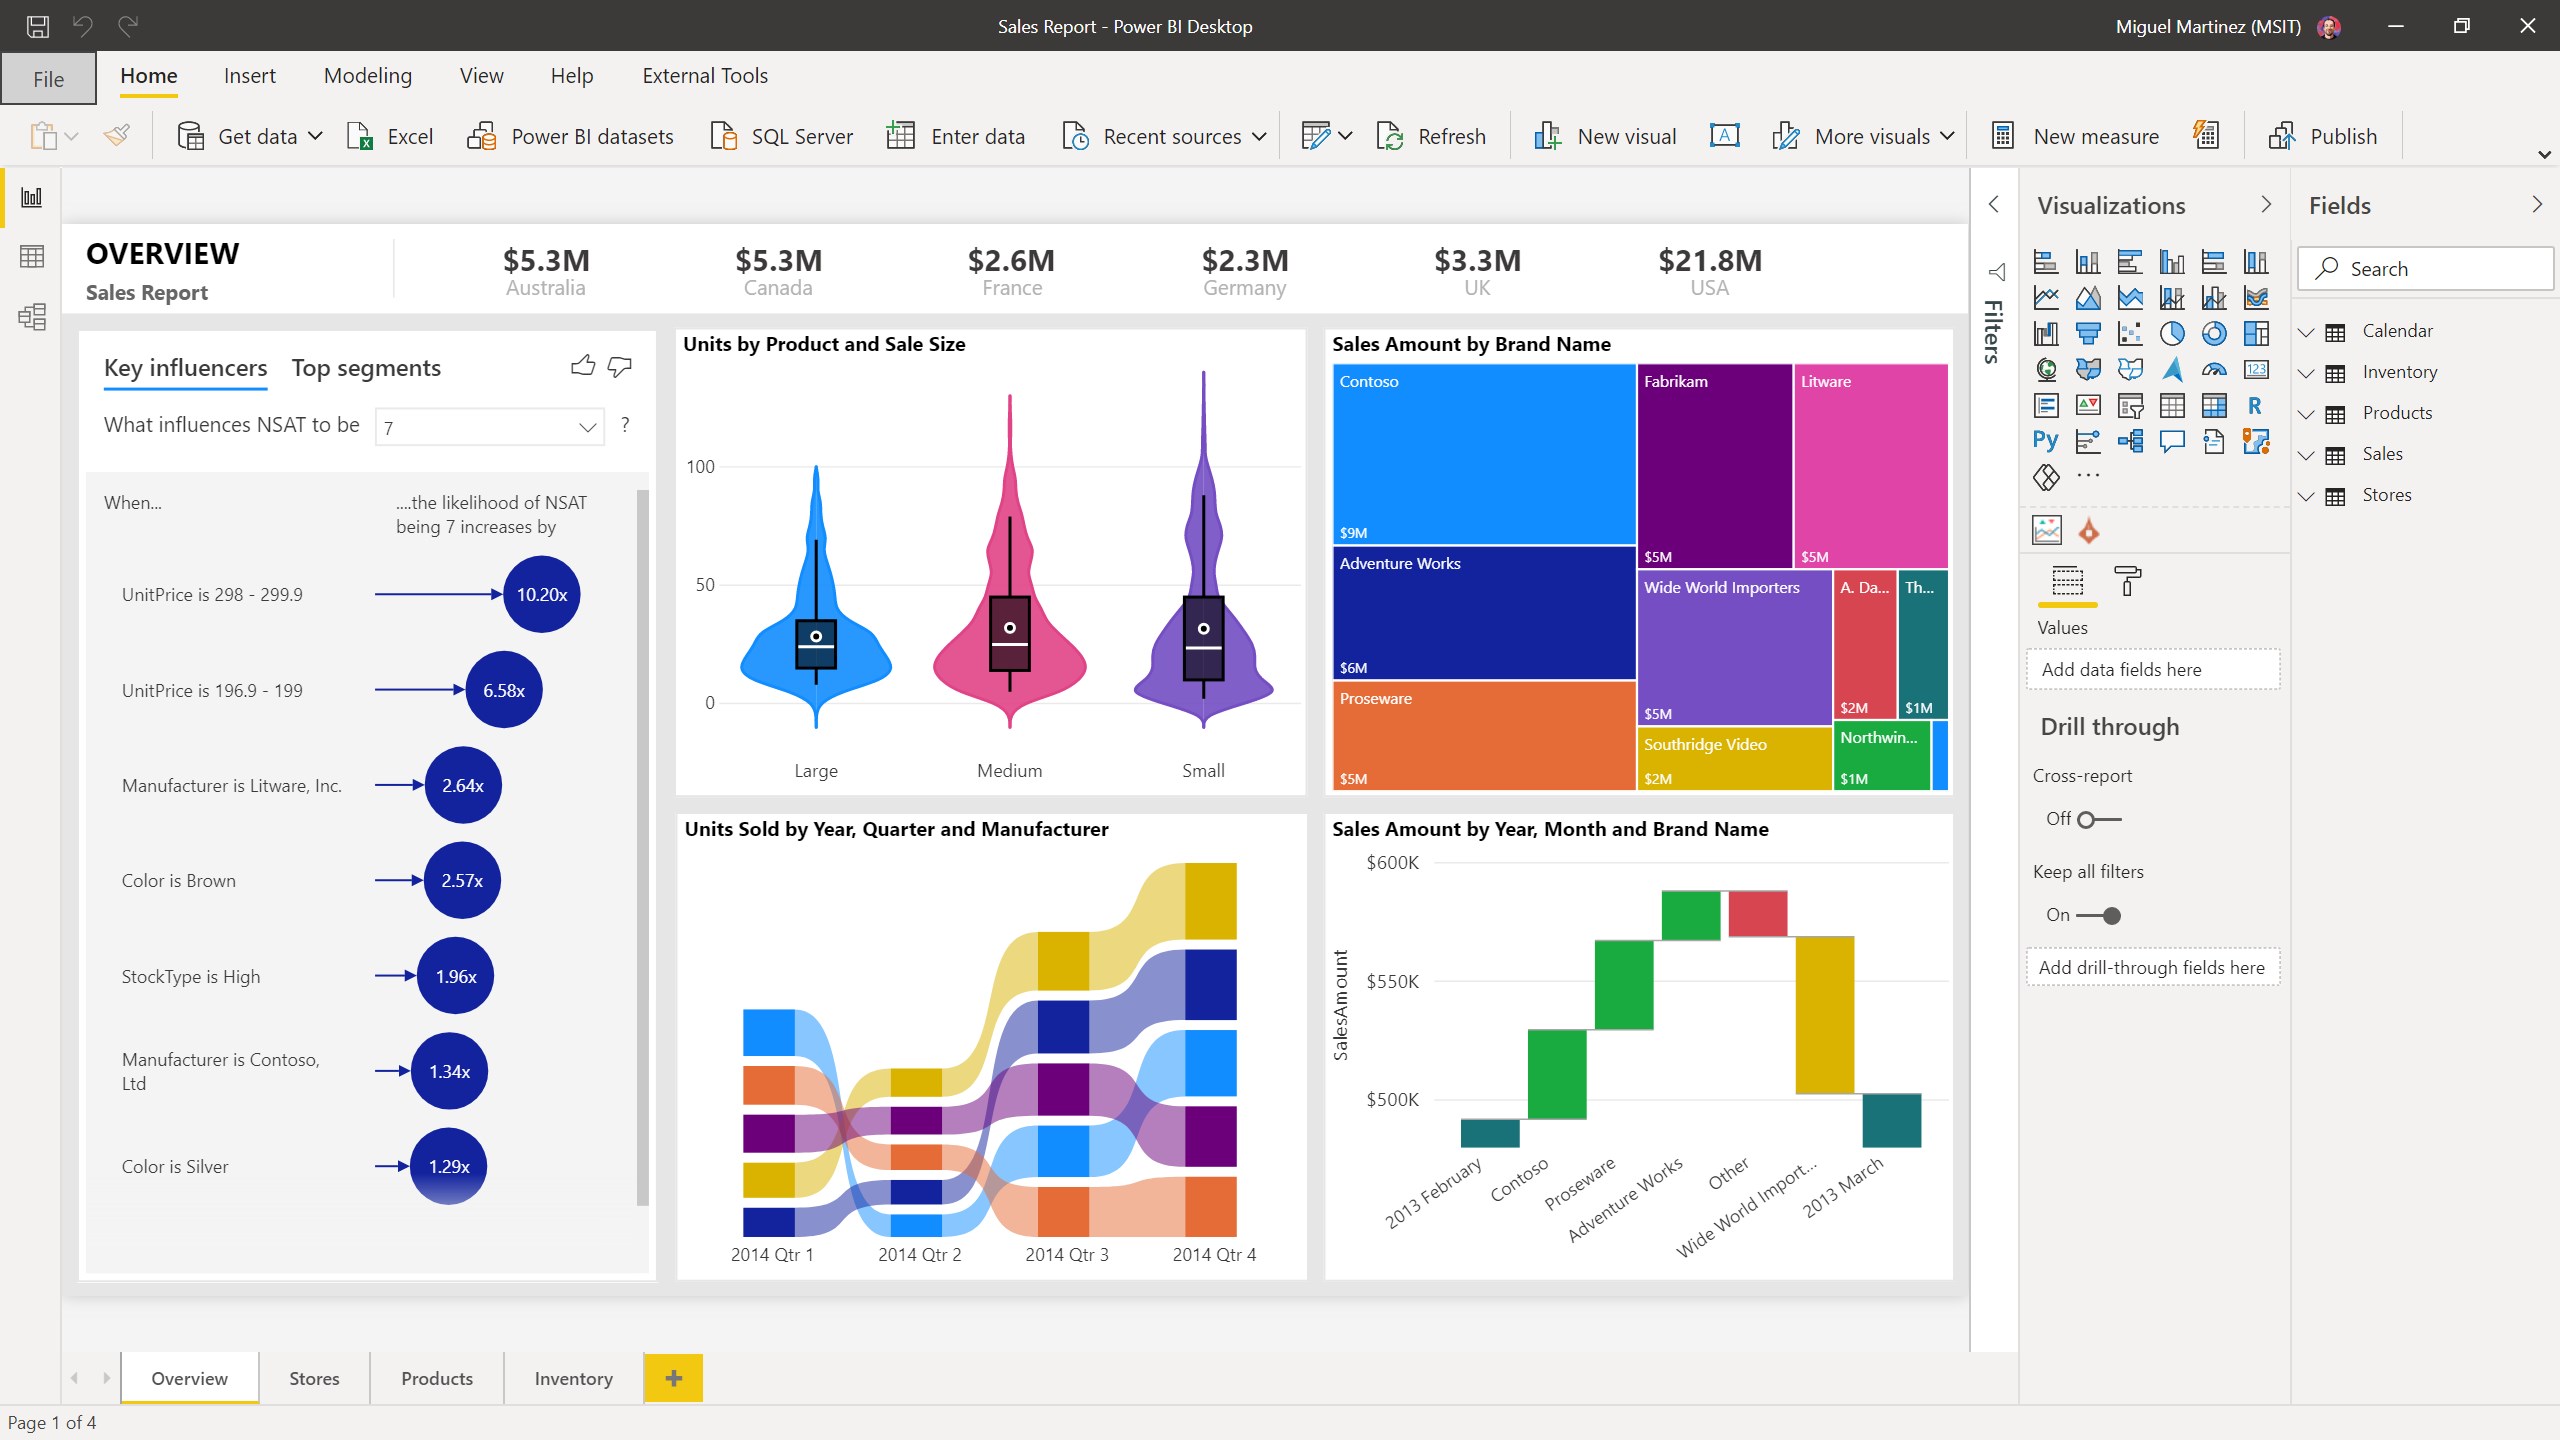
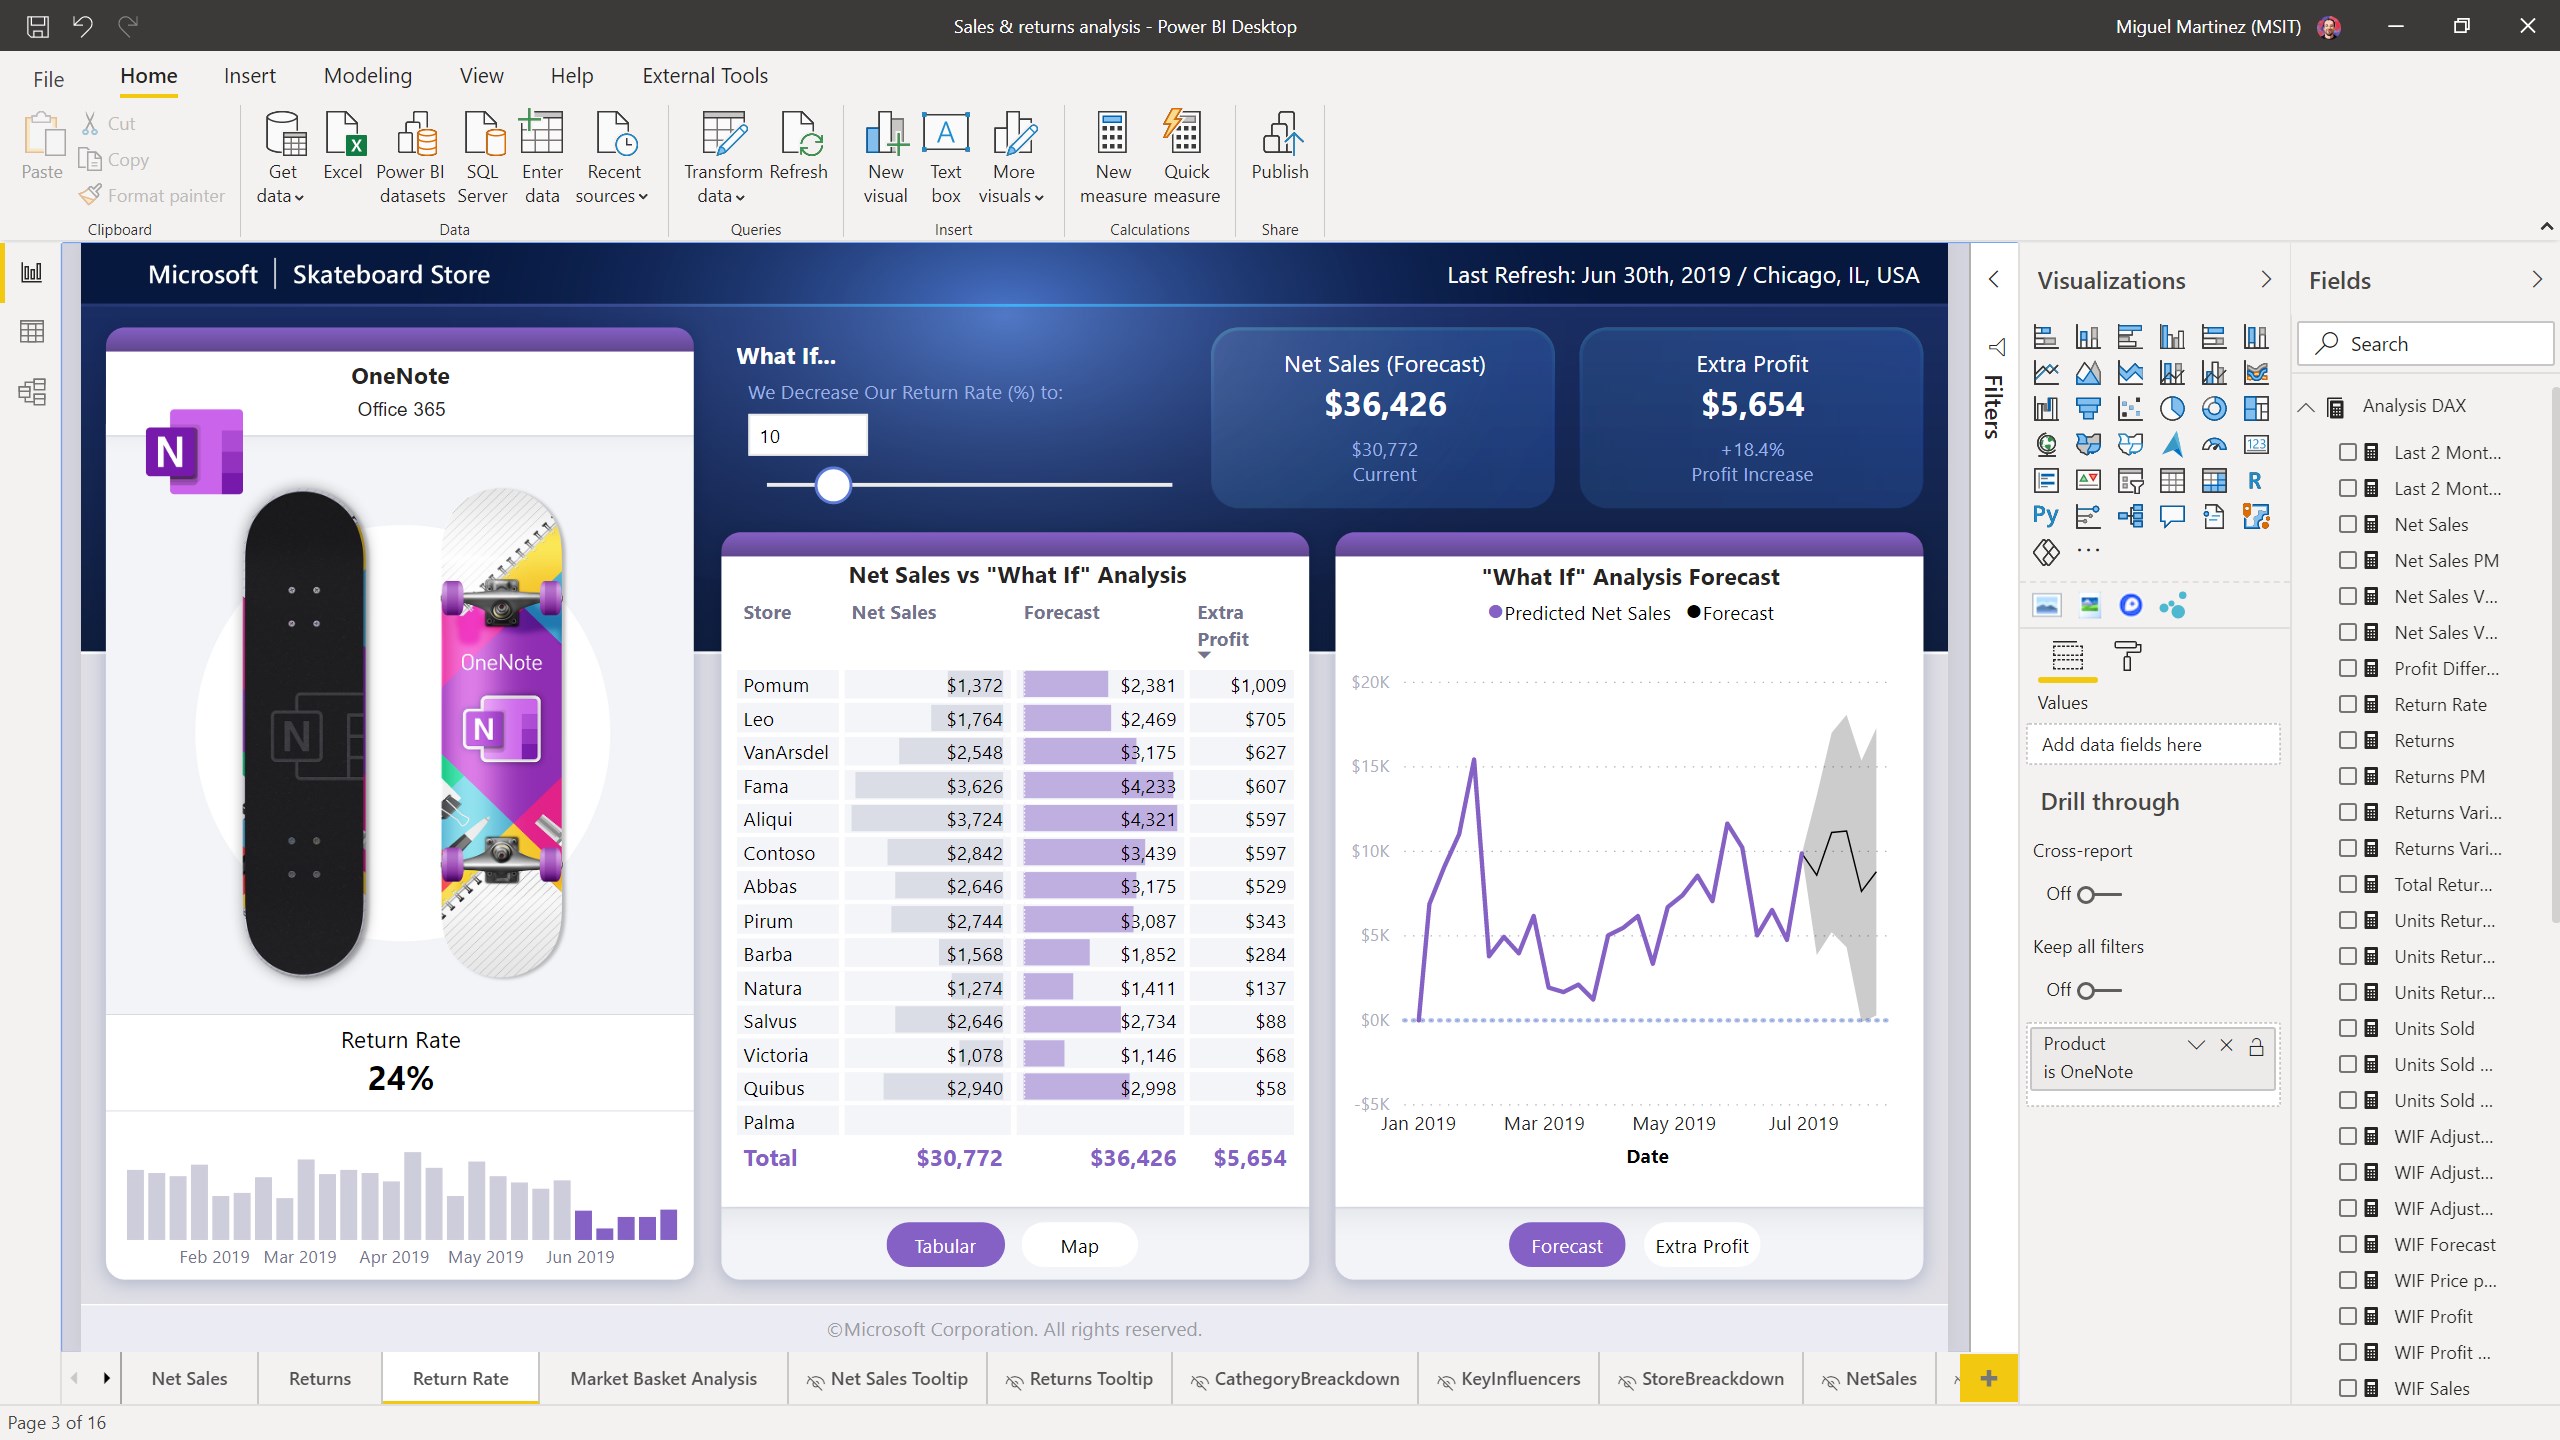
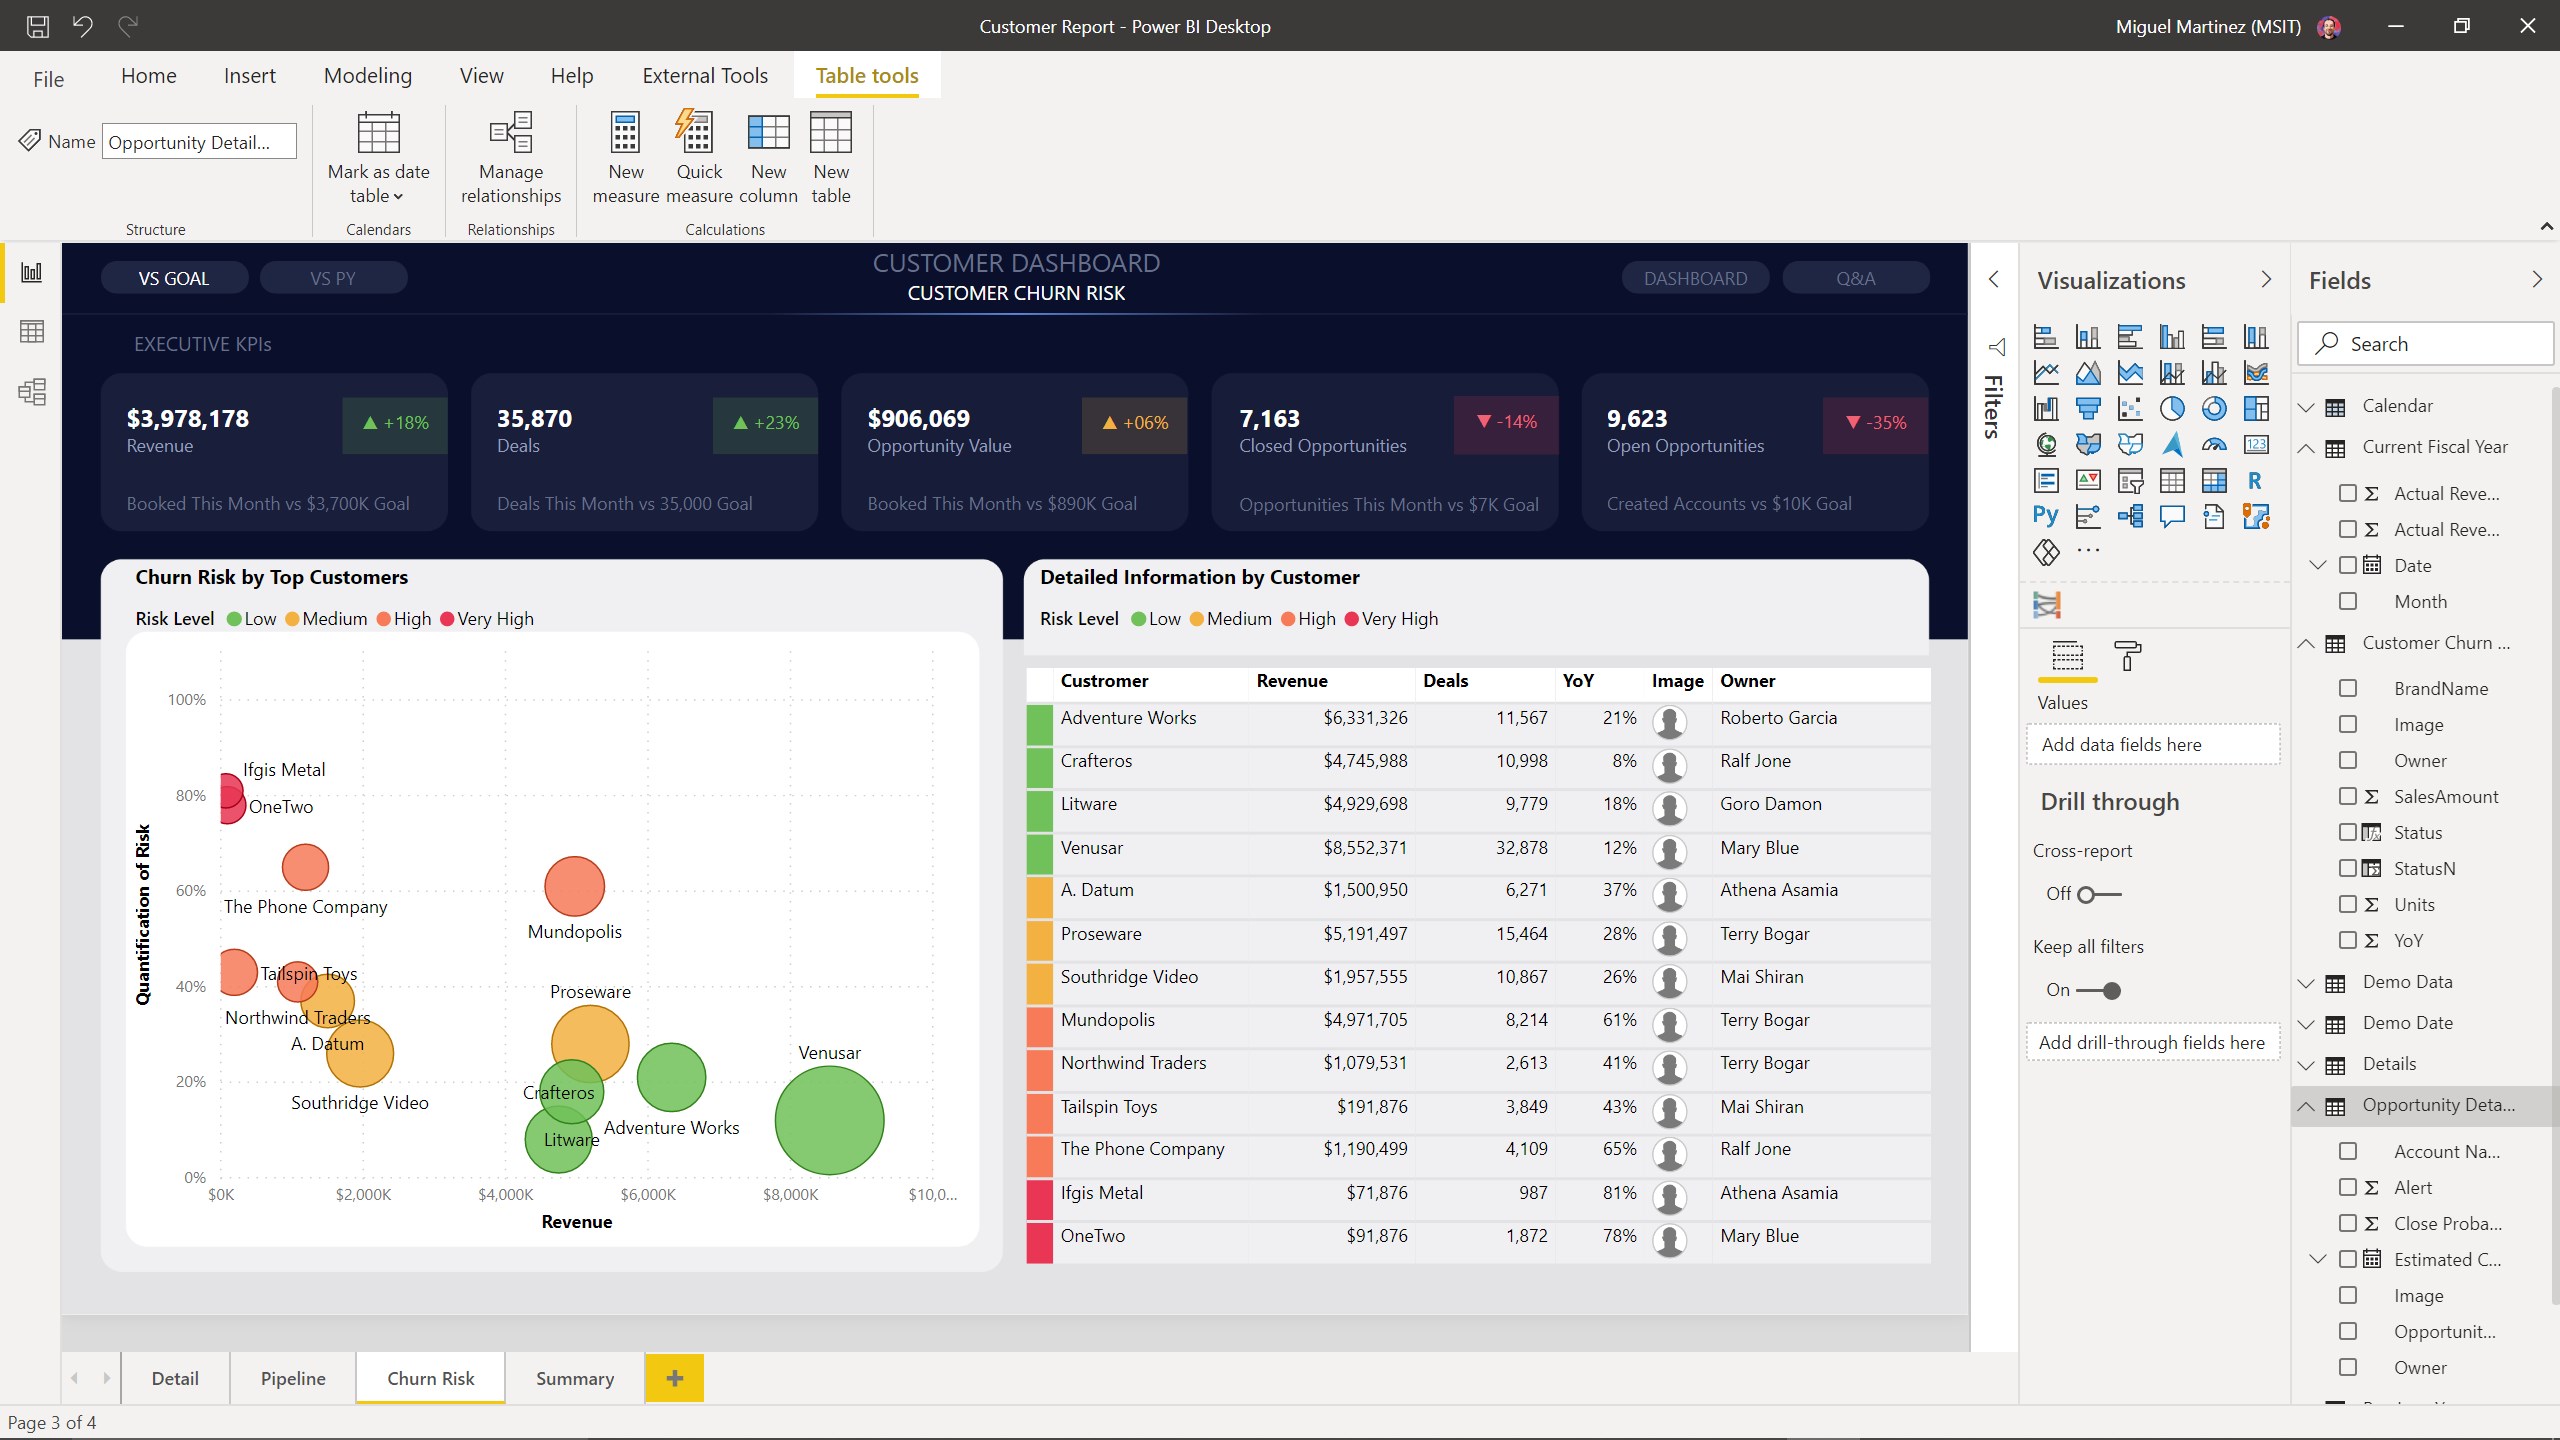
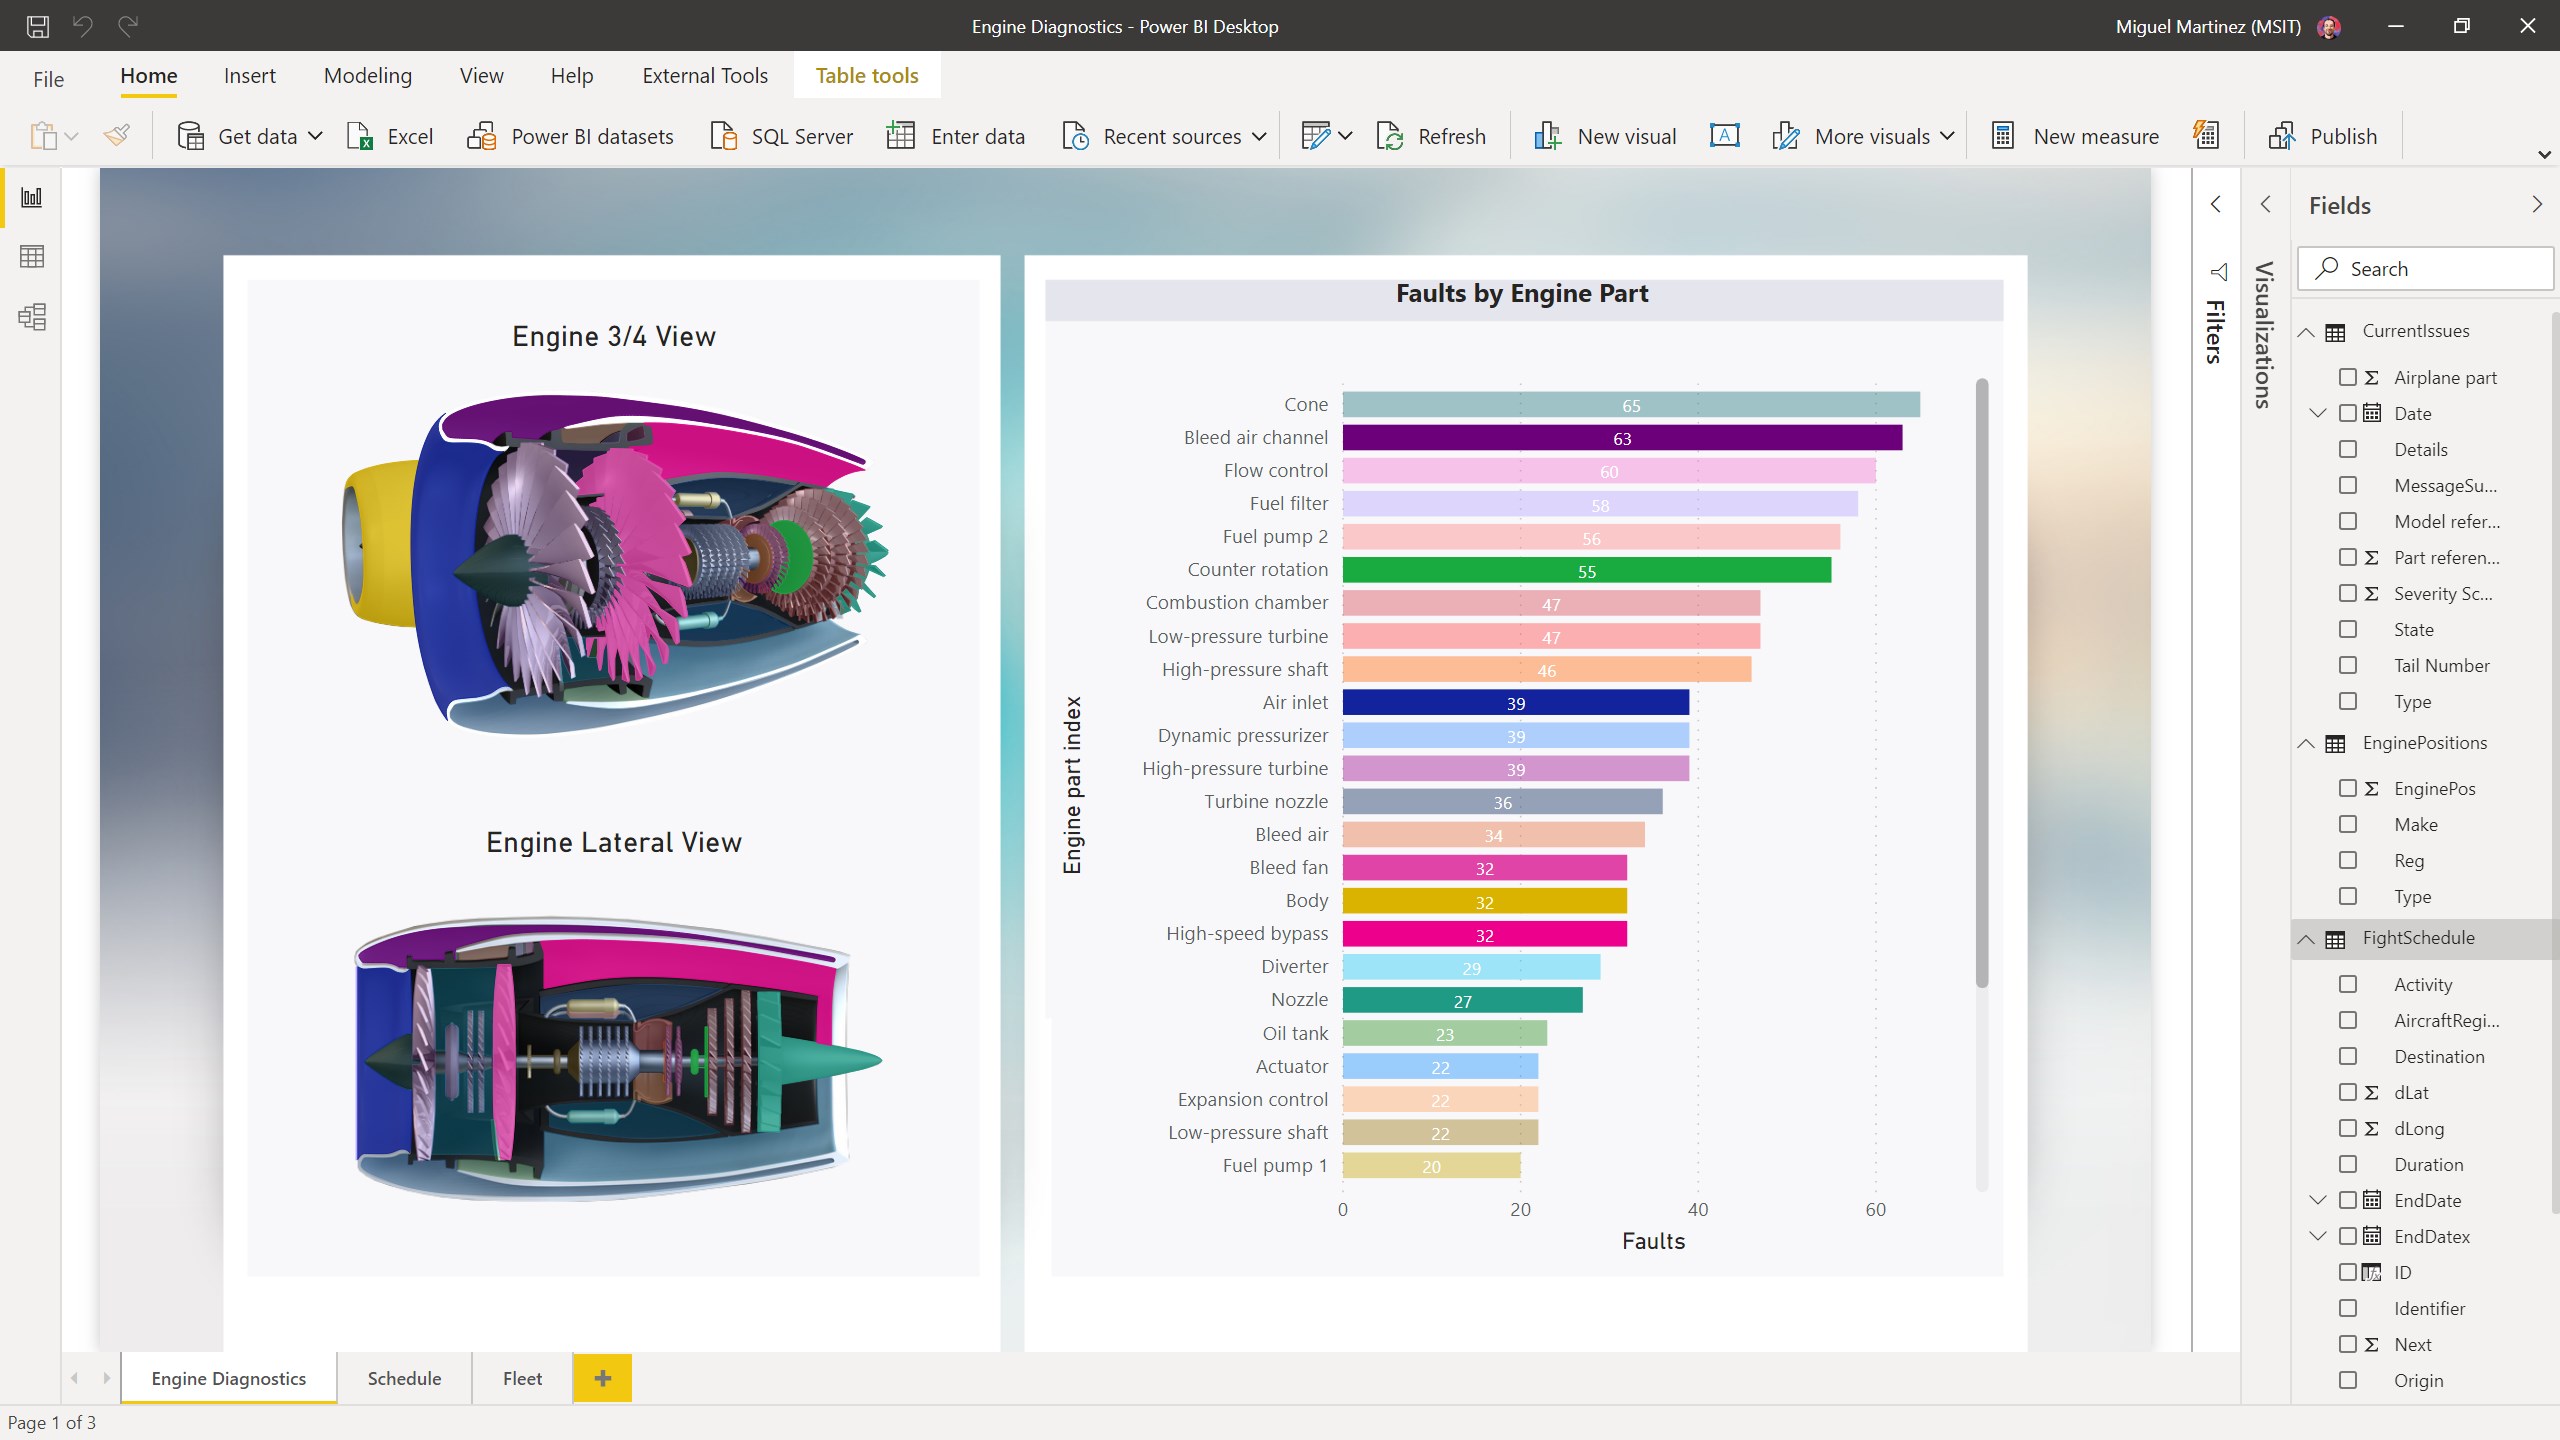
Robust Visualizations

Regular Updates and Support

Cons

Performance Issues with Large Datasets

Steep Learning Curve for Advanced Features

Limited Custom Visuals in Free Version

Occasional Bugs and Compatibility Issues

Dependence on Microsoft Ecosystem

Advertisement

Frequently Asked Questions

How do I get started with Power BI Desktop for the first time?

Download from the official website, install on your Windows device, then open the app and connect to your data sources using the 'Get Data' feature on the Home tab.

Can I create interactive reports in Power BI Desktop?

Yes, Power BI Desktop allows you to build interactive reports with clickable visuals, filters, and drill-down features to explore your data effectively.

How can I connect Power BI Desktop to my data sources?

Click on 'Get Data' on the Home ribbon, select your data source type, and follow the prompts to establish a secure connection and import your data.

What features are available for customizing data visuals?

You can choose from over 100 visuals, customize their appearance using formatting tools, and even create your own visuals to suit your analysis needs.

How do I publish my reports to share with my team?

Use the 'Publish' button in Power BI Desktop to upload your report to the Power BI web service, then share the dashboard link with your team members.

Is Power BI Desktop free, or does it require a subscription?

Power BI Desktop is free to download and use for creating and sharing reports locally; advanced sharing features may require a Power BI Pro license via subscription.

What are the subscription options for Power BI, and how do I upgrade?

Visit Settings > Account > Subscriptions in Power BI Service to view and upgrade your plan, such as subscribing to Power BI Pro for enhanced sharing capabilities.

How can I troubleshoot if my data connections fail?

Check your data source credentials, network connection, and ensure that the data source is accessible by reviewing error messages in the connection dialog.
Show more